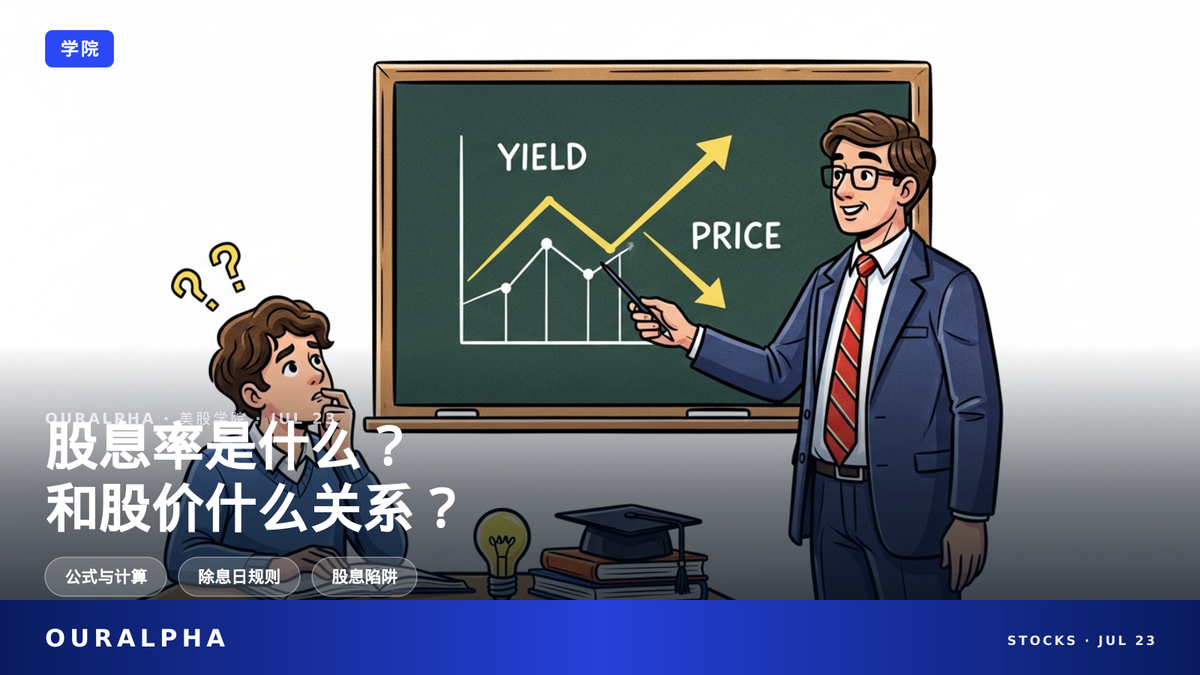
What Is Dividend Yield? Relationship with Stock Price, Calculation, and Pitfalls Explained

Dividend yield is a key metric for measuring cash return from dividends, but it moves inversely with stock price. A rising yield due to a falling price may not be good—it could be a 'dividend trap.'

What Is Dividend Yield? Relationship with Stock Price, Calculation, and Pitfalls Explained
OURALPHA · ACADEMY

What Is Dividend Yield?
Why Does It Rise When the Stock Price Falls?

OurAlpha Academy · Learn Dividend Yield in One Article

When buying stocks for dividends, dividend yield is an unavoidable metric.

But many don't know: dividend yield moves inversely with stock price—when the price drops, yield goes up.

This can hide a 'dividend trap,' a common pitfall for beginners.

TL;DR · IN SHORT

  • Dividend Yield = Annualized Dividend Per Share ÷ Current Stock Price
  • When the stock price falls, dividend yield automatically rises—it doesn't mean the company is paying more.
  • An abnormally high dividend yield may be a 'dividend trap'—watch for payout ratios over 100%.
  • You must buy before the ex-dividend date to receive the dividend; buying on that day won't qualify.

KEY TERMS

Dividend Yield: The percentage of annualized cash dividend per share relative to the current stock price, measuring the cash return you'd get from dividends if you buy at the current price.

Ex-Dividend Date: The date on and after which buyers of the stock are no longer entitled to the upcoming dividend.

Dividend Payout Ratio: The proportion of net income paid out as dividends, measuring how much of earnings is distributed.

Dividend Yield Trap: An abnormally high dividend yield caused by a stock price crash rather than increased dividends, often accompanied by a payout ratio over 100%, signaling a potential dividend cut.

CONTENTS

  1. How Is Dividend Yield Calculated?
  2. Why Does Dividend Yield Fall When the Stock Price Rises?
  3. When the Stock Price Falls and Yield Rises, Is That Good?
  4. What Is the Ex-Dividend Date? When Should You Buy to Get the Dividend?
  5. What Is a High Dividend Yield? What's the S&P 500 Average?
  6. How Much Tax Do You Pay on Dividend Income?
  7. Dividends vs. Stock Buybacks: Which Is Better for Shareholders?
  8. FAQ

How Is Dividend Yield Calculated?

Simply put, Dividend Yield = Annualized Cash Dividend Per Share ÷ Current Stock Price × 100%. For example, if a stock pays $2 per share annually and the current price is $50, the yield is 4%.[1] This percentage tells you: if you buy at the current price, how much cash return you'd get each year from dividends. Note that 'annualized' means multiplying the most recent dividend by the number of payments per year (usually 4), or using the total dividends paid over the past 12 months. The former is called 'forward yield,' the latter 'trailing yield.' When a company just changes its dividend, the two can differ—check which one your stock app uses.[8]

For example: suppose a company paid $0.50 per quarter over the last four quarters. The trailing yield is $2 divided by the current price. But if the company just announced it will raise the quarterly dividend to $0.60, the forward yield would use $0.60 × 4 = $2.40, while the trailing yield still uses the old $2. So the forward yield would be higher, but that doesn't mean you've received more cash. So when you see 'Yield' on a stock app, it's best to confirm whether it's forward or trailing to avoid being misled. Also, some companies pay dividends once a year, some quarterly, and some even monthly (like REITs)—adjust the annualization accordingly.

Why Does Dividend Yield Fall When the Stock Price Rises?

Because the denominator of dividend yield is the stock price, and the numerator is the dividend. The company decides how much to pay (dividend), while the market sets the price. When the price rises, the denominator gets larger, so yield falls; when the price falls, the denominator shrinks, so yield rises. So dividend yield changes passively with the stock price—it doesn't mean the company's dividend policy changed.[2] This is key: dividend yield is dynamic. A high yield you see might just be due to a price drop, not because the company is paying more.

Example: a company pays $2 annually. If the stock price goes from $50 to $100, the yield drops from 4% to 2%. You did nothing, yet your 'return rate' shrank—but you still get the same $2 cash. Conversely, if the price falls to $25, the yield becomes 8%, but the company still pays only $2. So a higher yield doesn't mean you're better off—you might have lost money on the stock.

This also explains why some high-quality growth stocks have low dividend yields: the market is optimistic about their future, driving the price up, so even if the company raises dividends each year, the yield may stay low. Conversely, a stock with a falling price will show an increasing yield, but that doesn't necessarily make it more attractive.

When the Stock Price Falls and Yield Rises, Is That Good?

Not necessarily. If a big price drop causes an unusually high yield—say over 10%—it's likely not because the company is paying more, but because the stock crashed. Such an inflated yield is often a sign of a 'dividend trap' (yield trap).[9] Many beginners get excited about high yields, but you need to understand the cause first.

How to tell? Look at the 'dividend payout ratio'—if dividends exceed current earnings (payout ratio > 100%), or if free cash flow is deteriorating, the dividend is likely unsustainable and may be cut or eliminated.[7] The payout ratio measures what portion of profits is paid out as dividends—it's a different dimension from dividend yield: yield is relative to stock price, payout ratio is relative to earnings.[7]

Example: a company earns $1 per share but pays $1.20 in dividends, a payout ratio of 120%. That means it needs to borrow or use reserves to pay dividends—clearly unsustainable. If earnings fall or cash flow tightens, the company will likely cut or eliminate the dividend, and the stock price may drop further. So don't jump in just because you see a high yield—check the fundamentals first. Also, check whether free cash flow covers the dividend; if free cash flow is negative, the dividend is even more risky.

What Is the Ex-Dividend Date? When Should You Buy to Get the Dividend?

After a company declares a dividend, it sets several key dates: the ex-dividend date, record date, and payable date.[3] Understanding these is important, or you might buy the stock and not get the dividend.

If you buy on or after the ex-dividend date, you won't be entitled to that dividend. You must buy before the ex-dividend date and hold through the record date to receive the cash.[4] The record date is when the company determines who its shareholders are; you must be a shareholder of record on that date to get the dividend. The ex-dividend date is usually the same as the record date. The payable date is when the cash actually arrives in your account.[5]

Also, on the ex-dividend date, the stock price typically drops by about the amount of the dividend per share, because new buyers no longer get that dividend and the company's assets have decreased. This is a normal adjustment, not a sign of trouble.[4] So don't mistake the ex-dividend price drop as bad news—it's just a price adjustment.

Example: Suppose a company declares June 2 as the ex-dividend date (same as record date). You need to buy on or before June 1 to be a shareholder of record on June 2 and receive the dividend. The payable date is usually one to two weeks after the record date. Note: the ex-dividend date is typically the same as the record date—this is due to the U.S. settlement system (T+1, meaning trade settles one business day after the transaction), so the actual last day to buy is one trading day before the record date. Also, if a single dividend is 25% or more of the stock's value, the ex-dividend date rule changes (it becomes the next trading day after the payable date), which applies to special dividends.[6] Ordinary investors can use this to know that very large special dividends don't follow the usual 'ex-date equals record date' rule.

What Is a High Dividend Yield? What's the S&P 500 Average?

The long-term historical average dividend yield of the S&P 500 is about 1.6%–1.8%, but as of July 2026, the actual reading is around 1.08%, near historical lows.[13] This broad market reference helps you judge whether a stock's yield is reasonable.

By sector, utilities, REITs (Real Estate Investment Trusts), and others tend to have higher yields. For example, U.S. tax law requires REITs to distribute at least 90% of taxable income to shareholders, so their yields are naturally higher.[11] This means REITs retain less cash for reinvestment and pay out more.

Generally, a yield above 5% is considered high, and above 8% warrants caution for a possible 'dividend trap.' But context matters: REITs might average 4%–6%, while tech stocks might be around 1%. So don't just look at the number—compare with peers in the same industry. Also, yield depends on growth: high-growth companies usually pay low dividends (low yield), while mature companies pay more (higher yield).

How Much Tax Do You Pay on Dividend Income?

Dividends are classified as 'ordinary dividends' or 'qualified dividends.' Ordinary dividends are taxed at your ordinary income tax rate. Qualified dividends, if you meet the holding period requirement (hold the stock for more than 60 days during the 121-day period around the ex-dividend date), are taxed at the long-term capital gains rate, typically 0%, 15%, or 20%—lower than ordinary rates.[10] So holding quality dividend stocks long-term is more tax-efficient.

For example, if you hold a stock for more than 60 days and meet other conditions, your dividends might be taxed at 15% instead of your top marginal rate (say 32%)—a nearly 50% tax discount. But note: dividends from special entities like REITs usually don't qualify for the lower rate and are taxed as ordinary income. Also, the tax rate depends on your total income: low earners may pay 0%, high earners 20%; high-income investors may also owe an additional 3.8% Net Investment Income Tax (a surtax on investment income for high earners). So knowing your tax bracket is important.

Dividends vs. Stock Buybacks: Which Is Better for Shareholders?

Both are ways to return value to shareholders, but they work differently. Dividends give you cash directly; buybacks use cash to repurchase shares, reducing shares outstanding, boosting earnings per share, and theoretically raising the stock price. Neither is inherently better—it depends on your goals: if you want steady cash flow, choose dividends; if you prefer price appreciation, buybacks might be better. Many companies use both.

Also, Dividend Aristocrats are S&P 500 companies that have increased their dividends annually for at least 25 consecutive years. They currently make up about 13.7%–13.8% of the S&P 500.[12] These companies typically offer stable dividends and moderate growth. They must meet liquidity thresholds like a minimum $3 billion market cap and $5 million average daily trading volume, so the bar is high. If you're looking for long-term, reliable dividend income, these stocks are worth watching.

常见问题 FAQ

Does a higher dividend yield always mean the stock is a better buy?

Not necessarily. A high yield may come from a falling stock price, not from higher dividends. Check the payout ratio and cash flow to see if it's sustainable, and avoid falling into a 'dividend trap.'[9]

If a company pays dividends monthly or quarterly, is the annualized yield calculated the same way?

The logic is the same, but you must first annualize the dividend by multiplying by the frequency (e.g., quarterly ×4, monthly ×12 for REITs) before dividing by the stock price. Don't just use a single payment amount.

What's the difference between dividend payout ratio and dividend yield?

Dividend yield is dividend divided by stock price, measuring cash return relative to cost. Dividend payout ratio is dividend divided by net income, measuring what portion of earnings is paid out. They are different dimensions.[7]

What are 'Dividend Aristocrats'?

'Dividend Aristocrats' are S&P 500 companies that have increased their dividends annually for at least 25 consecutive years. They currently make up about 13.7%–13.8% of the S&P 500.[12]

Why are REIT dividend yields generally high?

U.S. tax law requires REITs to distribute at least 90% of taxable income as dividends to avoid corporate income tax, so their dividends are naturally high.[11]

Does the stock price always drop on the ex-dividend date?

In theory, it should drop by about the dividend amount per share, but in practice, market sentiment may cause deviations. This is a price adjustment, not a signal of decline.[4]

Which price is used to calculate dividend yield—current price or my purchase price?

Dividend yield is usually calculated using the current stock price, reflecting 'how much cash return you'd get if you buy now.' If you already own the stock, your actual return should be based on your purchase cost.

SOURCES

[1] Investor.gov Glossary: Dividend
[2] MSCI: Beware high dividend yield traps
[3] Investor.gov: Ex-Dividend Dates
[4] Charles Schwab: Ex-Dividend Dates — Understanding Dividend Risk
[5] FINRA Notice to Members 00-54
[6] Corporate Finance Institute: Dividend Payout Ratio
[7] Corporate Finance Institute: Forward Dividend Yield
[8] IRS Topic 404: Dividends and Other Corporate Distributions
[9] SEC Investor Bulletin: Real Estate Investment Trusts (REITs)
[10] S&P Dow Jones Indices: S&P 500 Dividend Aristocrats
[11] GuruFocus: S&P 500 Dividend Yield

This content is for informational purposes only and does not constitute investment advice, trading advice, or any guarantee of returns.

Keep Reading

Trailing P/E vs. Forward P/E: What's the Difference? A Simple Guide

Trailing P/E vs. Forward P/E: What's the Difference? A Simple Guide
OURALPHA · ACADEMY

Dynamic P/E vs. Trailing P/E:
Why Does the Same Stock Have Two P/E Ratios?

US Stock Academy · Understand the Two P/Es to Avoid Valuation Mistakes

Open a stock app, and you might see two different P/E ratios for the same stock: one high, one low.

Beginners often think there's only one P/E, but trailing P/E and forward P/E tell completely different stories.

Understand the difference, and you'll see what the market is really betting on.

Read full story →

Stay ahead of the market — never miss a deep dive

Follow OurAlpha for AI-driven US equity research and market insight, every day.