Oil Drops, Gold Climbs: Citi Cuts Brent Forecasts as US-Iran Deal Clears Hormuz
Citi slashed its Brent crude forecasts after the US-Iran framework deal pointed to Strait of Hormuz reopening — but gold rallied for a third straight session, with markets focused on easing inflation expectations rather than fading safe-haven demand.

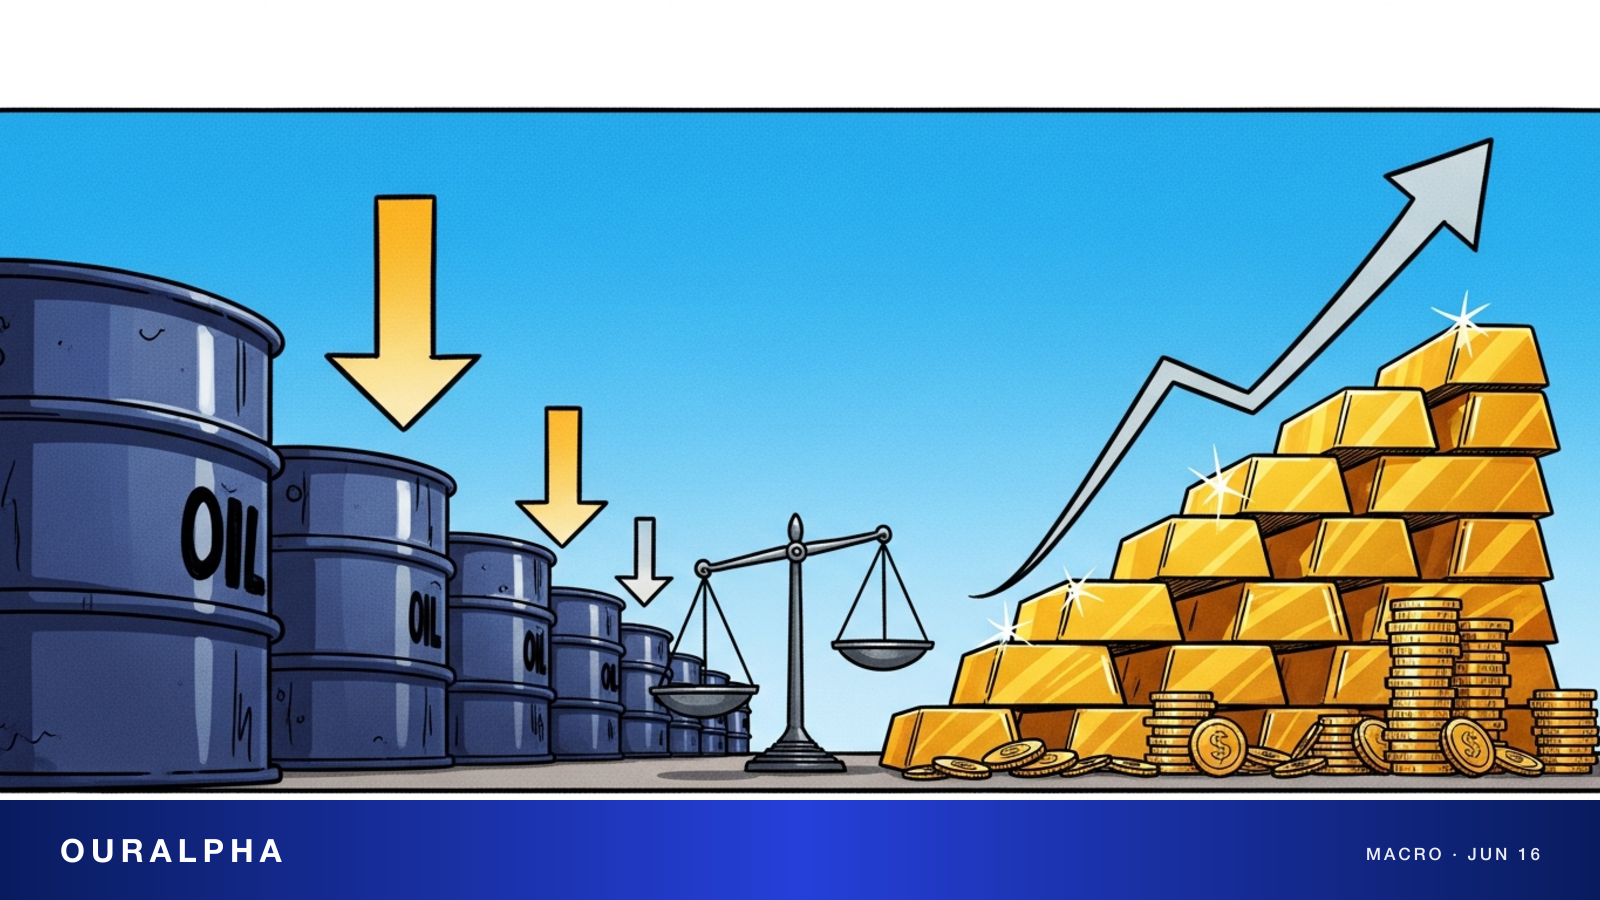
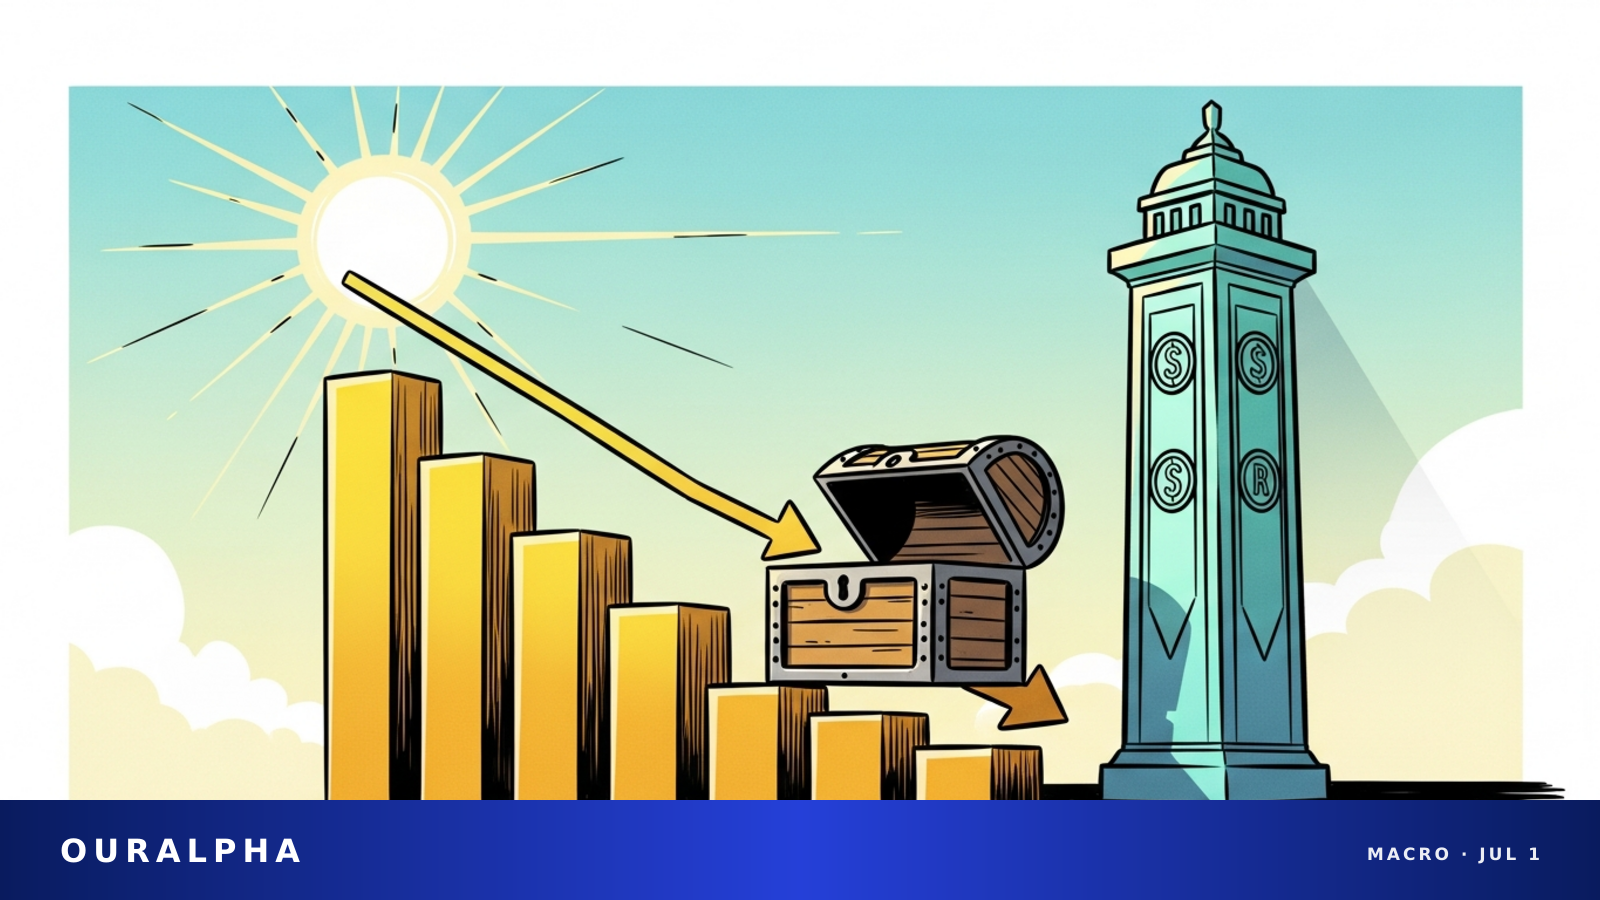
Bottom line: After the US and Iran reached a framework agreement pointing to Strait of Hormuz reopening, Citi cut its Brent crude price forecasts. At the same time, gold didn't retreat on fading geopolitical risk — it rallied for a third straight session, with markets reading the combination as an inflation-pressure story, not a safe-haven one.
- Citi cut its Q3 and Q4 2026 Brent crude average price forecasts to $75/bbl and $70/bbl, respectively.
- Citi cut its 2027 Brent forecast from $80/bbl to $65/bbl, effectively adopting its prior bear-case scenario as the new base.
- Citi's new base case — assigned roughly 60% probability — assumes an MoU is signed and Hormuz oil flows normalize by mid-to-late July.
- Brent crude fell to roughly $83/bbl, its lowest level in about two months.
- Spot gold rose to approximately $4,338.90/oz, up about 2.77% on the day, for a third consecutive session of gains.
The prospect of US-Iran de-escalation is producing two opposite price signals within commodities. Oil sold off sharply as Hormuz passage appeared set to resume, prompting institutional forecast cuts. Gold, meanwhile, ignored the cooling geopolitical temperature and kept climbing. That oil-down, gold-up combination became one of the market's focal points after the deal was announced.
What Citi Actually Changed
Against the backdrop of falling oil prices, Citi revised its Brent crude outlook on Monday. Citing Reuters, Kitco reported that Citi cut its average Brent price forecasts for Q3 and Q4 2026 to $75/bbl and $70/bbl, respectively, and slashed its 2027 average forecast from $80/bbl to $65/bbl — effectively shifting to what had previously been its bear-case scenario[Kitco].
Citi spelled out the assumptions behind its new base case: the scenario is assigned roughly 60% probability and rests on the MoU being signed, with subsequent negotiations ultimately restoring Strait of Hormuz oil flows to broadly normal levels by mid-to-late July[Kitco]. In short, the lower forecasts are conditional — they stand only if the deal holds and the waterway reopens.
Oil: A Two-Month Low
The forecast cuts followed the price move itself. According to CNBC, Brent crude fell to roughly $83/bbl on the back of the US-Iran agreement — its lowest in about two months[CNBC].
The logic is straightforward on the supply side:
- The Strait of Hormuz carries roughly one-fifth of global oil supply; the earlier blockade had sharply reduced throughput.
- The prospect of the waterway reopening reduced fears of a sustained supply disruption.
- Easing supply-side pressure is being read by markets as disinflationary — a factor that could take some heat off prices more broadly.
Worth noting: these are immediate post-announcement moves. Whether oil continues lower depends on the formal signing of the deal and how implementation unfolds.
Gold: Why It's Still Rallying Despite Cooling Tensions
Gold's behavior stands in sharp contrast. Conventional logic says easing geopolitical risk should dent safe-haven demand and weigh on gold — yet the opposite happened. According to TradingEconomics data, spot gold rose to approximately $4,338.90/oz, up about 2.77% on the day, for a third consecutive session of gains[TradingEconomics].
The market's prevailing explanation isn't about safe havens — it's about rates and inflation expectations. The chain of reasoning runs roughly as follows:
- Gold pays no yield, so its carry cost is closely tied to real interest rates (nominal rates minus inflation expectations).
- When oil prices surged earlier, they pushed inflation expectations higher and reinforced bets that the Fed would hold rates elevated or even hike — a headwind for gold.
- Now, with oil pulling back and inflation pressure easing at the margin, the probability of a rate-hike scenario falls, lifting some of that pressure off gold.
In other words, the market appears to be weighting the "oil falls → inflation expectations ease → rate pressure eases" channel as a bigger driver for gold right now than the "geopolitical risk fades → safe-haven demand drops" channel. That's the dominant read — not a settled verdict. Gold's path from here remains subject to many crosscurrents.
The Strait of Hormuz and the Deal's Timeline
Both the oil price outlook and broader commodity pricing hinge on the deal's pace and remaining uncertainties. According to TechTimes, the Strait of Hormuz had been blockaded for 107 days, severely curtailing oil transit; under the agreement, the strait is set to reopen, but full physical normalization will take time — the Pentagon's internal estimates put complete demining operations at up to roughly six months[TechTimes].
On the timeline, multiple outlets reported that President Trump said Monday the US and Iran have signed a Memorandum of Understanding, with a formal signing planned for June 19 in Geneva, Switzerland. That will kick off a 60-day formal negotiation period covering core issues including limits on Iranian uranium enrichment and the scope of sanctions relief[Bloomberg].
Variables to Keep in Mind
A few caveats before drawing a straight line from here. First, Citi's lower oil forecasts are explicitly conditional on the deal being signed and the waterway reopening — the 60-day negotiating window means outcomes are still reversible; a breakdown would likely unwind both the strait reopening and the oil price pullback. Second, the physical timeline for Hormuz normalization (including demining) may lag market expectations. Third, gold is simultaneously driven by the dollar, real rates, central bank buying, and other factors — the "easing inflation expectations" narrative alone doesn't explain the full picture. This article summarizes institutional views and public data and does not constitute a recommendation on crude oil, gold, or any other asset.
Sources
- Kitco / Reuters — Citi cuts Brent forecasts as U.S.-Iran MoU points to Strait of Hormuz flow normalization
- CNBC — Oil drops as Iran, U.S. set to sign peace deal
- TradingEconomics — Gold price
- TechTimes — Strait of Hormuz Reopens: US-Iran Deal Ends 107-Day Blockade but Mines Remain
- Bloomberg — Industrials Stocks Hit Record as US-Iran Deal Lifts Market Optimism
This content is for informational purposes only and does not constitute investment advice, trading advice, or any guarantee of returns.