US-Iran Sign 60-Day Ceasefire, Hormuz Blockade Lifted — Oil Posts ~8% Weekly Loss
The US and Iran signed a 60-day ceasefire on June 17 and Washington lifted its Strait of Hormuz blockade a day later, easing Middle East tensions and dragging crude oil down roughly 8% on the week. A Trump threat on June 21 sparked a brief intraday spike but didn't change the trend.

Bottom line: Over the past week-plus, US-Iran tensions over the Strait of Hormuz de-escalated materially — both presidents signed a 60-day ceasefire, Washington lifted its blockade of the Strait, and crude followed suit, falling ~8% last week. WTI was hovering near $77/bbl on Monday, June 22.
- June 14: US and Iran announced a Memorandum of Understanding (MoU); June 17: both presidents signed, setting a 60-day ceasefire.
- June 18: US lifted the Hormuz blockade; Swiss technical-phase talks were postponed.
- June 21 (6:45 PM ET): Trump issued threatening remarks, injecting uncertainty into the Swiss talks timeline and briefly spiking oil prices.
- WTI crude: ~$77.54/bbl on June 22, up ~0.27% on the day; Brent trading slightly above WTI.
- Oil fell ~8% last week overall; Pakistan brokered the deal.
- June 18 US equities rallied, led by chips: Dow closed at 51,564.70 (+0.14%), S&P 500 +1.08%, Nasdaq +1.91%.
Heading into late June, the US-Iran standoff over the Strait of Hormuz has broadly shifted toward de-escalation. Based on publicly available information, the two sides reached an MoU in mid-June, both presidents signed it into a 60-day ceasefire, and the US subsequently lifted its Hormuz blockade. Crude oil moved in lockstep, falling ~8% last week, with WTI trading in a narrow range near $77/bbl on Monday, June 22[UK House of Commons Library].
Weekly Timeline
The key milestones of this de-escalation, in chronological order:
- June 14: US and Iran announced a Memorandum of Understanding (MoU), a framework document covering subsequent arrangements;
- June 17: both presidents signed the agreement, formally establishing a 60-day ceasefire;
- June 18: the US lifted its blockade of the Strait of Hormuz; technical-phase talks scheduled in Switzerland were postponed the same day;
- June 21 (6:45 PM ET): Trump issued threatening remarks, adding uncertainty to the logistics of the Swiss talks[Wikipedia].
Pakistan served as mediator in this round of diplomacy. The negotiating agenda spans freedom of navigation, Iran's nuclear and missile programs, and post-conflict reconstruction and sanctions arrangements[Wikipedia]. Freedom of navigation determines whether the Strait — a critical chokepoint for global crude flows — remains open. The nuclear and missile dossier covers Iran's security posture and external oversight. Reconstruction and sanctions deal with the economic and diplomatic aftermath once the ceasefire period ends. These issues are deeply intertwined and form the core of what the parties must negotiate within the 60-day window[Wikipedia].
On the broader regional picture, an Israel-Hezbollah ceasefire also took effect last Friday, roughly in step with the US-Iran cooling — providing additional backdrop to this round of regional de-escalation[UK House of Commons Library]. This article presents only the publicly available arrangements and timeline; no judgment is made on any party's position.
How Oil Sold Off
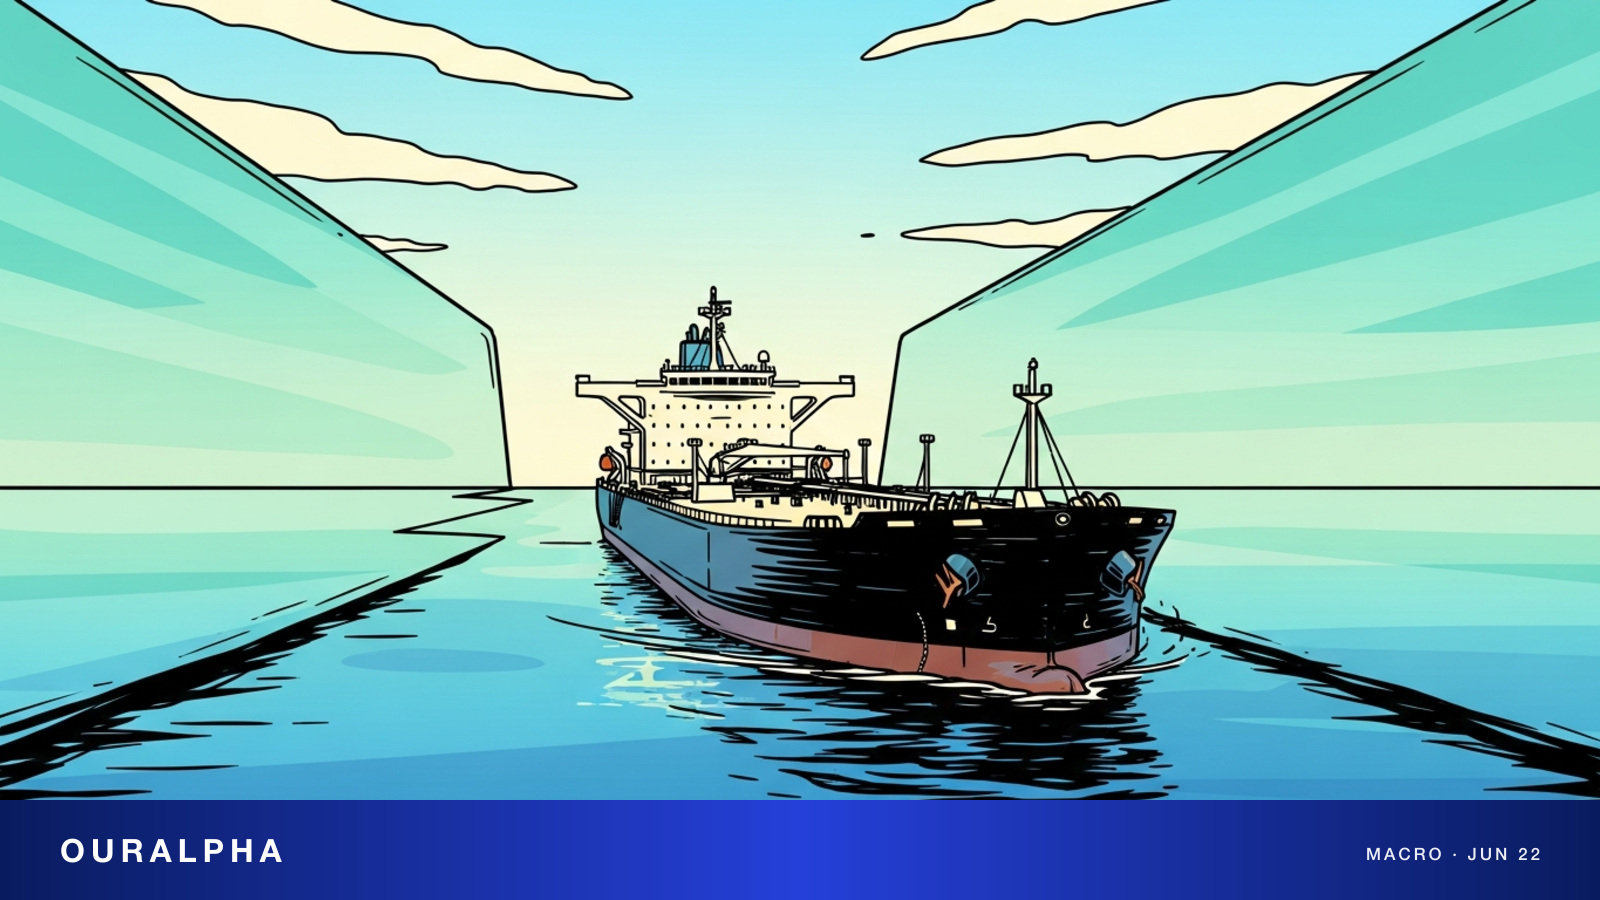
The Strait of Hormuz is one of the world's most critical oil transit chokepoints, and shifts in its status tend to transmit directly into crude prices. As the blockade lifted and the ceasefire took shape, oil moved broadly lower last week.
- WTI crude fell ~8% on the week — a move the market widely attributed to easing geopolitical risk;
- As of June 22, WTI was at ~$77.54/bbl, up ~0.27% on the day;
- Brent crude was trading slightly above WTI;
- Trump's threatening remarks on June 21 triggered a brief intraday spike in oil, but the overall trend remained lower[Trading Economics].
In short, the dominant story last week was a crude selloff. The June 21 evening bounce was a news-driven blip, not a trend reversal[Bloomberg]. The transmission mechanism is straightforward: when the blockade lifts and a ceasefire lands, markets reprice supply-disruption risk lower; a threatening statement temporarily reverses that, which is precisely what happened on the evening of June 21[Trading Economics].
Spillover to US Equity Risk Appetite
Geopolitical developments and oil moves typically feed into equities through risk appetite. When tensions ease and crude pulls back, markets generally pare fears of cost inflation and supply disruption.
- On June 18, against the backdrop of the blockade being lifted, US stocks rallied — led by semiconductors: the Dow Jones Industrial Average closed at 51,564.70 (+0.14%), the S&P 500 gained ~1.08%, and the Nasdaq Composite rose ~1.91%;
- Trump's remarks on the evening of June 21 weighed on US equity futures and lifted oil, illustrating that headline risk continues to cut both ways[Yahoo Finance].
Note that June 22 is a Monday in US Eastern time, so regular US equity trading had not yet opened at the time of this writing — the most recent closing figures cited here are from June 18[Trading Economics].
What to Watch
Key things to monitor going forward: whether the Swiss technical-phase talks are rescheduled and what progress they make within the 60-day window; the specifics of negotiations on freedom of navigation and Iran's nuclear and missile programs; and how oil prices react as headlines continue to swing in both directions. The positives are the blockade lifting and the ceasefire holding; the wildcards are the postponed talks and individual statements that could re-introduce volatility. The pace and trajectory of all parties remains to be seen — this article covers only publicly available facts and the timeline as it stands[UK House of Commons Library].
Sources
This content is for informational purposes only and does not constitute investment advice, trading advice, or any guarantee of returns.