Oil Prices Shed 8% Last Week — What It Means for Energy Stocks and Airlines
WTI crude slid back to around $77 a barrel last week, posting an 8% weekly loss as Middle East tensions eased. The divergent playbook: lower oil typically pressures energy producers while offering relief on airline fuel costs.


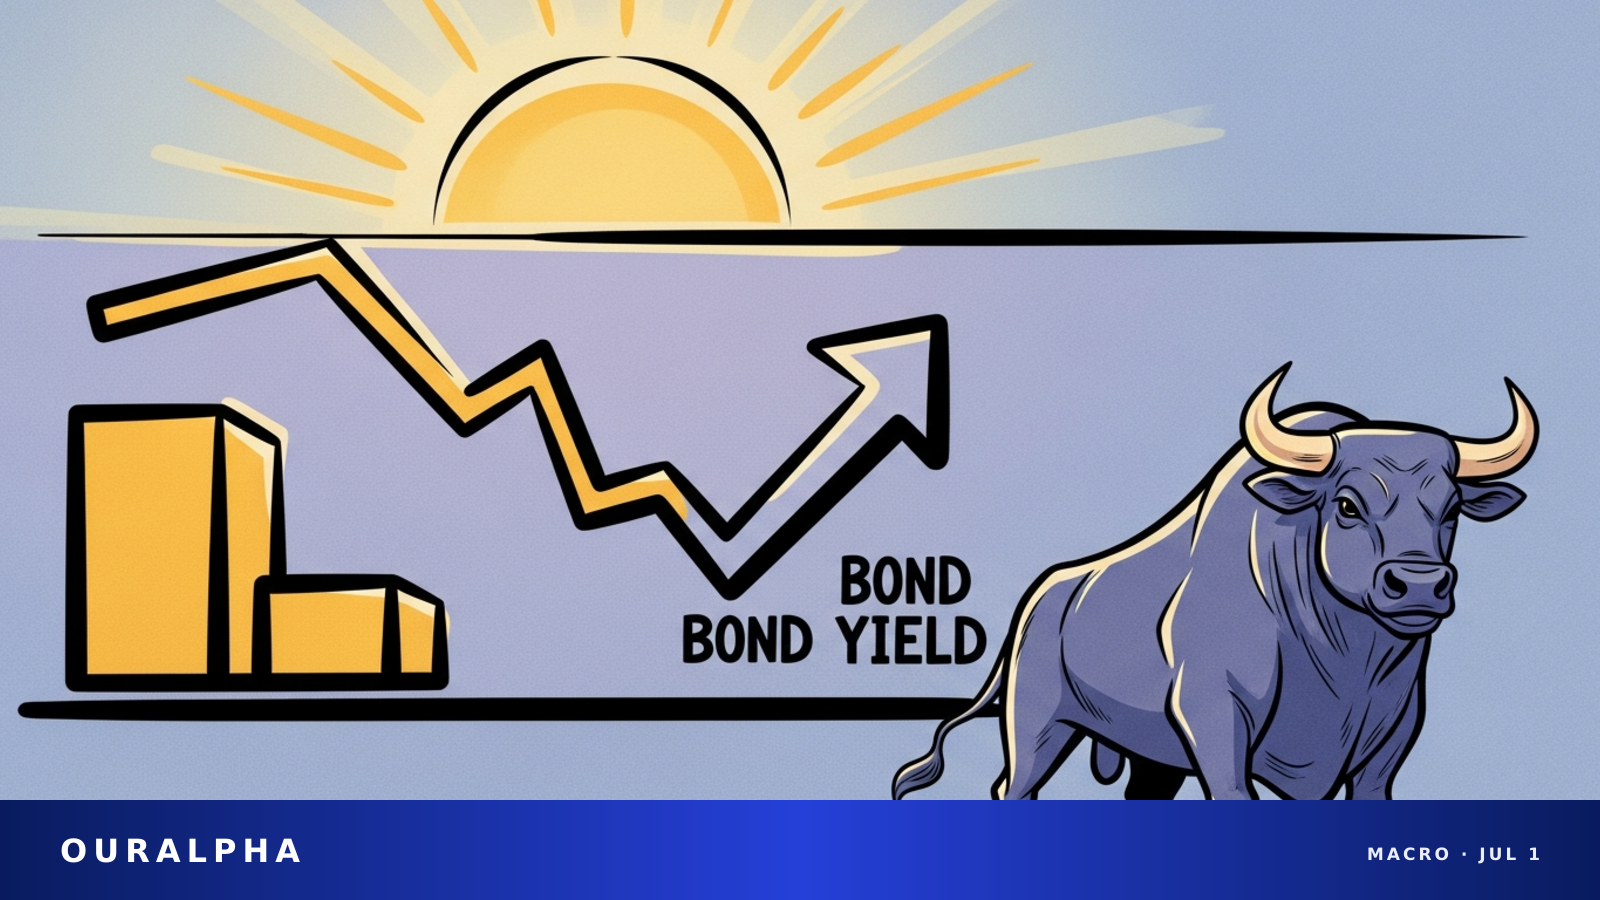
Bottom line: International crude prices fell roughly 8% last week as Middle East tensions cooled, pulling WTI back to around $77 a barrel. Conventional wisdom holds that falling oil pressures energy stocks while offering some fuel-cost relief for airlines.
- WTI crude was quoted at approximately $77.54/bbl on June 22, up a modest ~0.27% on the day but down ~8% on the week.
- Brent crude traded slightly above WTI and moved in the same direction.
- The selloff coincided with a de-escalation in the Middle East: a 60-day US-Iran ceasefire was signed June 17, and the US lifted its Strait of Hormuz blockade on June 18.
- The broad market view: lower oil tends to squeeze energy sector margins while easing airline fuel bills — though company-specific outcomes depend on each firm's own disclosures.
Crude prices retreated broadly over the past week. According to Trading Economics, WTI crude was trading around $77.54 per barrel on June 22 — a fractional gain of ~0.27% on the day, but a weekly decline of roughly 8%[Trading Economics]. Brent crude tracked the same direction, holding a slight premium to WTI throughout[Trading Economics]. The move has refocused attention on a perennial market debate: how does an oil price swing ripple differently through the energy sector versus the airline industry?
Why Oil Fell Last Week
The timing of the selloff lined up with a notable easing of Middle East geopolitical risk.
- On June 17, the US and Iran signed a 60-day ceasefire agreement[Yahoo Finance].
- The following day, June 18, the US lifted its blockade of the Strait of Hormuz[Yahoo Finance]. The strait is one of the world's most critical chokepoints for crude flows, and a reduction in supply-disruption fears typically drains the geopolitical risk premium from prices.
- The picture remained fluid heading into this week. Bloomberg reported that a fresh round of hawkish rhetoric on June 21 sparked a brief intraday pop in oil, but the broader trend stayed negative[Bloomberg].
Worth noting: oil prices are driven by a confluence of supply-demand fundamentals, inventory data, and geopolitical factors. The chronological overlap with these events does not make them the sole causal explanation for the move.
Energy vs. Airlines: The Standard Playbook
The directional impact of oil prices on different sectors is well-trodden ground in equity markets. What follows is the generally accepted sector-level logic — not a call on any individual stock.
- For the energy sector, falling crude typically compresses revenue and margins for upstream exploration and production companies. Lower oil prices are broadly seen as a headwind for the sector.
- For airlines, jet fuel is one of the largest operating cost line items. A drop in crude generally signals potential relief on that cost, which markets tend to read as a relative tailwind.
- That said, these are industry-level generalizations. The actual impact on any given company depends on its hedging arrangements, fleet mix, ticket pricing, and load factors — all of which vary by carrier or producer and must be assessed from each company's own disclosures.
This article makes no price-target or return call on any specific energy or airline name. In the absence of verified company-level data, the analysis stays at the sector transmission-mechanism level.
Broader US Equity Backdrop
The oil move is just one variable in a more complex market picture.
- US equities have shown mixed but broadly constructive performance recently, according to Trading Economics[Trading Economics]. On June 18, a chipstock-led rally lifted all three major indexes: the Dow closed at 51,564.70 (+0.14%), the S&P 500 gained ~1.08%, and the Nasdaq rose ~1.91%[Trading Economics].
- US equity futures were leaning lower in early pre-market trading on June 22 as markets continued to digest the back-and-forth on geopolitical headlines, per Bloomberg[Bloomberg].
- Note that US regular trading hours open at 9:30 a.m. ET; any quotes circulating before then reflect pre-market activity and should be interpreted accordingly.
The key variables to watch this week: how the Middle East situation develops, how any fresh moves in crude feed through to energy and airline names, and whether the sector-level divergence holds as the news flow evolves.
Sources
This content is for informational purposes only and does not constitute investment advice, trading advice, or any guarantee of returns.