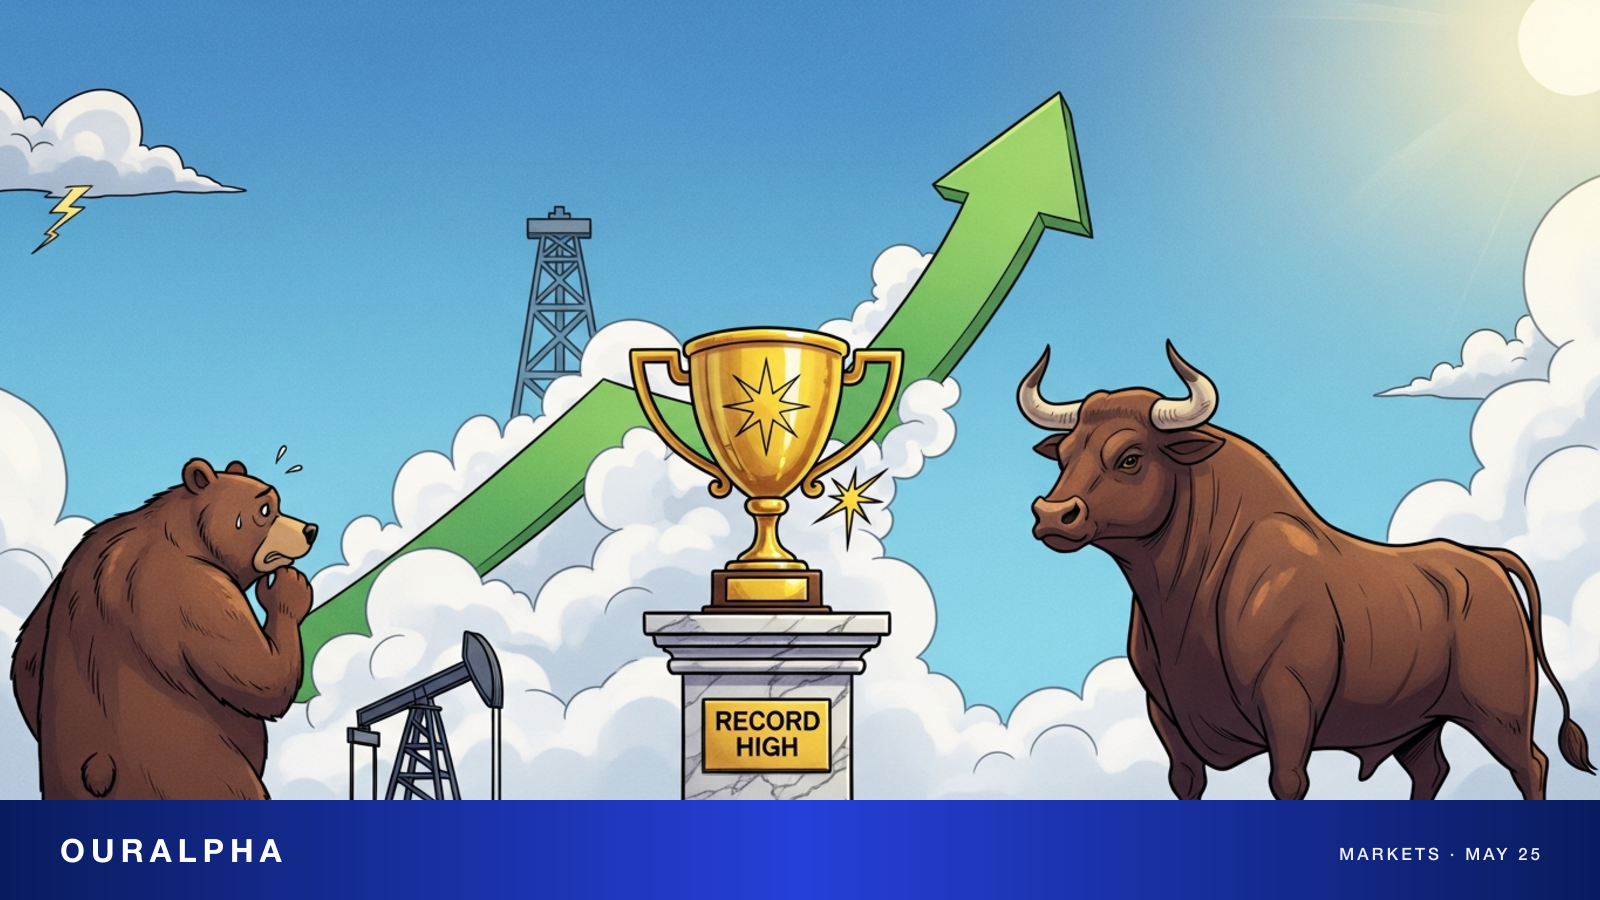
Dow Hits a Record High. Here's What the Market Is Actually Telling You.
The Dow closed at an all-time high on Friday, May 22 — up nearly 300 points — even as WTI briefly touched $103, the Fed pushed back rate-cut timelines, and Nvidia's print sparked a sector split. Here's how to read the structure beneath the headline.

TL;DR
On Friday, May 22, the Dow closed at a record high — capping a week that wrong-footed most traders. WTI briefly hit $103, the Fed's rate-cut path got pushed out further, and Nvidia's earnings triggered a visible split within AI names. Through all of it, the market didn't crack. It broke higher.
- Dow +~300 points on the day; S&P 500 +0.4%, Nasdaq Composite +0.2% — modest in isolation, but the combination sends a real signal
- Leadership: defensive cyclicals + industrials (CAT, HON, BA, MMM) + consumer staples (PG, KO, WMT)
- Three structural supports: healthy rotation within AI rather than an AI selloff; energy's index-level drag offset by energy-stock gains; and U.S. growth continuing to surprise to the upside even as inflation runs warm
- The macro setup — WTI below $100, April PCE on a disinflationary path, a data-dependent Fed that's stopped tightening — is the cleanest runway of 2026
Friday, May 22: the Dow closed at a record high, ending a week that surprised almost everyone. WTI briefly hit $103, the Fed's rate-cut timeline got pushed out again, and Nvidia (NVDA) sparked a visible split across AI names after its print — yet the broader market held together. According to MarketWatch, the Dow gained nearly 300 points; the S&P 500 added 0.4% and the Nasdaq Composite 0.2%. The individual moves look modest. Together, they say something important.
The right question heading into Monday is: how did this happen — and what does it mean for positioning into June?
How the session unfolded
The Dow's record-setting structure was classic defensive cyclical and industrial leadership: Caterpillar (CAT), Honeywell (HON), Boeing (BA), and 3M (MMM) led the charge, while consumer staples — Procter & Gamble (PG), Coca-Cola (KO), Walmart (WMT) — served as low-beta ballast. Energy names contributed positively, with Chevron tracking WTI's strength.
On the tech side, the Dow's relatively smaller tech allocation — Apple (AAPL), Microsoft (MSFT), Salesforce (CRM) — outperformed the equal-weight Nasdaq, reflecting a clear preference for large-caps with reliable cash flows over higher-multiple AI infrastructure plays.
The S&P 500's +0.4% headline masked meaningful internal rotation. Equal-weight beat cap-weight by roughly 30 basis points, and advance-decline breadth improved across the tape. By sector, Financials and Industrials led; Communication Services and Tech lagged. The Russell 2000 also outperformed on the day, narrowing the small-cap-versus-large-cap gap to its tightest in three weeks — one of the clearest signals that the market views the Q1 rate-repricing as largely complete.
Why the market held under three headwinds
Three structural reasons.
First, the split within AI is a sign of health, not stress. Nvidia gave back gains post-earnings, but Microsoft, Alphabet, and Amazon held flat to slightly higher — money didn't leave the AI theme, it rotated within it. That kind of internal churn is far healthier than an across-the-board multiple compression on AI, and it explains why the Nasdaq headline was muted while AI-adjacent industrials and infrastructure names quietly outperformed.
Second, the oil shock was largely hedged at the index level. WTI at $103 hammered airlines and consumer-facing stocks, but energy equities' positive contribution offset most of that drag. The index looked calm; underneath the surface, sector volatility was substantial.
Third — and most important — U.S. growth keeps beating expectations even as inflation runs warm. The Atlanta Fed's Q2 GDPNow estimate is tracking above 2.5%; initial jobless claims remain near cycle lows; and earnings revisions kept moving higher through the reporting season. When you combine a Fed that has to stay hawkish with a growth backdrop that refuses to roll over, you get an equity market that runs ahead of where rates and oil "should" put it.
What this means for positioning
The more interesting question isn't how the Dow hit a record — it's what kind of positioning that record implies. Three observations.
One: breadth has improved in a way that matters. Equal-weight indices have outpaced cap-weight over the past two weeks, which means this rally is no longer being carried by five mega-caps. That's a structurally healthier tape than 2024.
Two: the rotation within AI is creating genuine bottom-up opportunities that simply didn't exist three months ago. Capital that rotated out of Nvidia post-earnings can now revisit the entire AI capex ecosystem — including infrastructure names (Vertiv, Eaton, Quanta Services, GE Vernova) that have quietly outperformed in recent weeks — without paying peak Nvidia multiples.
Three: the second-half 2026 macro setup is the cleanest of the year. WTI has stabilized below $100, April PCE confirmed a gradual disinflationary trend, and the Fed is on hold in a data-dependent posture rather than actively tightening. The market now has a runway that doesn't require a dovish surprise to move higher.
The honest summary: a record high doesn't mean expensive. It means the market is correctly pricing the resilience of U.S. corporate earnings — and the capacity to sustain that resilience through a genuinely difficult macro environment.
Three signals that determine direction this week
One: how the spot market responds Tuesday to the holiday-weekend futures rally and any subsequent oil pullback. Whether gains hold on real volume is the first test of this breakout's credibility.
Two: Friday's April PCE print. Core PCE at +3.2% or below opens the most direct path for a June–July rally; a print of +3.4% or above would force a significant repricing of Fed expectations.
Three: the direction of the spread between Nvidia and equal-weight tech. A widening gap signals genuine sector rotation; a narrowing gap suggests the move was positioning-driven, not fundamental.
If all three align, June–July sets up as the cleanest stretch of the year. If they don't, a summer pullback becomes meaningful — but after Friday's close, the burden of proof sits squarely with the bears.
Sources
This content is for informational purposes only and does not constitute investment advice, trading advice, or any guarantee of returns.