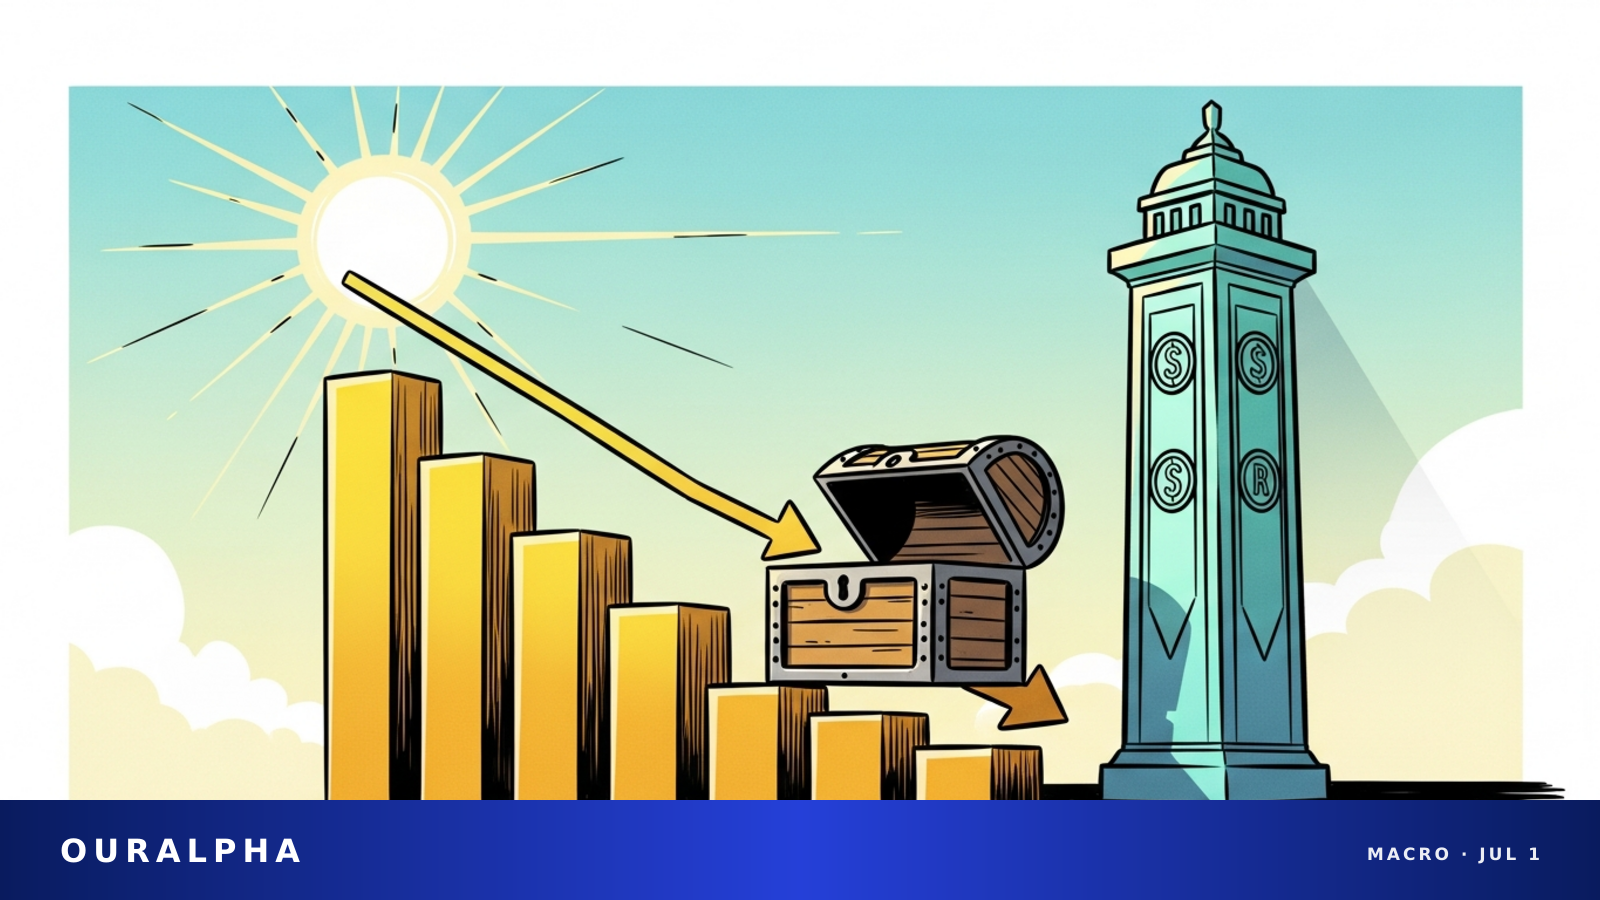
Gold Slips 0.7% to Seven-Month Low as Yields, Fed Rate Bets Bite
Gold slid to its lowest since November, pressured by rising Treasury yields and a hawkish Fed repricing. The yellow metal is on track for its worst quarter since 2013.

Gold prices extended their slide in early Asian trade Wednesday, with spot bullion touching its lowest level since November. Rising Treasury yields, a hawkish repricing of Fed rate expectations, and fading hopes for a permanent US-Iran peace deal are all weighing on the non-yielding metal.
- As of 2:00 AM ET (14:00 Beijing time) on July 1, spot gold was trading at $3,979.41/oz, down 0.7% on the day.
- In the prior session (June 30), gold had already fallen to $3,942.99/oz, a seven-month low not seen since last November.
- US gold futures for August delivery fell 1.1% to $3,992.70/oz on Wednesday.
- Gold posted its fourth consecutive monthly decline in June and is on track for its steepest quarterly drop since 2013.
- The 10-year Treasury yield rose to around 4.4%, while the 2-year yield held above 4.10%, reinforcing expectations for higher rates.
- The Fed held rates at 3.50%-3.75% at its June meeting, but its dot-plot raised the median 2026 rate forecast to 3.8% from 3.4% and hiked its 2026 PCE inflation forecast to 3.6% from 2.7%.
Gold prices extended their losses during Asian trading on Wednesday (July 1), as stronger Treasury yields and persistent Fed rate-hike expectations continued to pressure the metal. Diminishing hopes for a permanent US-Iran peace deal added to the uncertainty around inflation and the rate outlook. As of 2:00 AM ET (14:00 Beijing time), spot gold was at $3,979.41/oz, down 0.7% from the previous day.[CNBC In the prior session (June 30), the metal had already fallen to $3,942.99/oz, its lowest level since last November.[CNBC US gold futures for August delivery fell 1.1% to $3,992.70/oz on Wednesday.[CNBC
Treasury Yields and Fed Dot-Plot Dominate Market Sentiment
The core pressure on gold is coming from the rates market. The Federal Reserve voted 12-0 on June 17 to hold the federal funds rate target range at 3.50%-3.75%, but its June dot-plot raised the median 2026 rate forecast to 3.8% from 3.4% in March, while sharply hiking its 2026 PCE inflation forecast to 3.6% from 2.7%.[Kitco This hawkish signal has pushed Treasury yields higher: the 10-year yield rose to 4.377% on June 29 and further to around 4.469% on June 30, while the 2-year yield held above 4.10%.[Kitco[Kitco
In a June 29 report, Kitco noted that precious metals were not following the equity rally, trading as rate-sensitive assets rather than pure geopolitical hedges.[Kitco On that day, the Nasdaq Composite rose 2.1% and the Dow Jones Industrial Average closed above 52,000 points, hitting a record high, but gold and silver failed to follow suit.[Kitco The report stated that "the post-FOMC reaction remains the dominant positioning constraint," with safe-haven buying in gold, while present, taking a back seat.[Kitco
US-Iran Tensions and Oil Prices: Safe-Haven Demand Canceled by Inflation Fears
On the geopolitical front, the evolving US-Iran tensions have had a complex impact on gold. On June 29, CNBC reported that fresh US-Iran clashes in the Gulf region pushed oil prices higher, while Fed rate-hike expectations further pressured the non-yielding metal.[CNBC On that day, WTI crude rose 2.2% to $70.75/barrel, and Brent crude gained 1.6% to $73.15/barrel.[Kitco
Transit through the Strait of Hormuz was a key market focus. According to Kitco, on June 29, the number of transits fell to 22, the weakest day since the US and Iran signed a preliminary ceasefire agreement, following a cargo ship attack on Thursday and an oil tanker incident on Saturday.[Kitco The US and Iran agreed on Sunday to stop attacking each other and resume peace talks, but transit through the strait remained difficult for ship owners, charterers, and crews.[Kitco By June 30, Kitco reported that transit numbers were nearing pre-war levels, but Iran still retained leverage over routes, inspections, and traffic management.[Kitco
In a July 1 report, CNBC pointed out that fading prospects for a permanent US-Iran peace deal were fueling ongoing concerns about inflation and Fed rate hikes.[CNBC The market interpretation is that rising oil prices, through the inflation channel, reinforce the risk of Fed rate hikes rather than triggering dominant safe-haven asset allocation.[Kitco
Silver Diverges: Gold Weak, Silver Strong with Different Technical Backdrops
In contrast to gold's persistent weakness, silver showed relative strength on June 30. Kitco data showed spot silver rising 0.50% to $58.470/oz, with a New York spot trading range of $56.53 to $60.55.[Kitco The report noted that silver's strength was supported by a lower gold-to-silver ratio and stronger relative momentum.[Kitco
On the technical front, Kitco analysts provided key levels in their June 29 report. For spot gold, the next upside target for bulls is to push prices back to the resistance zone of $4,100.00 to $4,170.85, with a sustained break targeting $4,382.62 and $4,452.75; the near-term downside target for bears is to break below $3,959.08, with deeper support at $3,900.00 and $3,886.46.[Kitco For spot silver, the bulls' target is to return to the $59.58 to $61.51 area, with a break above targeting $62.38 and $65.97; the bears' target is to break below $55.70, with deeper support at $54.49 and $54.23.[Kitco
Analyst Outlook: Cautious Near Term, Bullish Long Term
Several institutions and analysts have offered differing views on gold's outlook. Jeffrey Christian of CPM Group, in a June 30 commentary, noted that after falling below $4,000, gold recovered to around $4,040, but the $4,000 level could continue to be tested, and prices could move toward $3,800 during the summer consolidation period.[Kitco He said CPM Group is cautious on gold and silver in the near term but bullish long term, citing expectations that economic and political conditions could become more adverse later this year and into 2027.[Kitco Christian also discussed the relationship between real rates and gold prices, arguing it is complex and that investors need to understand what is driving rates rather than blindly using them as an indicator.[Kitco
Former Merrill Lynch broker Stewart Thomson, in a June 27 commentary, argued that the current pullback is partly technical—gold surged from around $1,800 to $5,600 without a sufficient consolidation.[Kitco He noted that many central banks paused or even sold gold during the Iran war, but with the Strait of Hormuz largely reopening, central banks are eager to resume buying.[Kitco Thomson said that while he cannot guarantee gold has already bottomed, it is fair to say that "tremendous value (fundamental, technical, and cyclical) is being offered to investors."[Kitco
Sources
- CNBC — Gold prices slip as firmer Treasury yields, Fed rate outlook weigh
- Kitco — Gold, silver weaken as Fed repricing overwhelms haven demand - Kitco PM Report
- Kitco — Silver firms while gold fades as Fed risk caps rebound - Kitco PM Report
- CNBC — Gold slips as fresh U.S.-Iran strikes boost oil, Fed rate-hike bets weigh
- Kitco — Gold and silver market update: Why interest rate changes may mislead investors
This content is for informational purposes only and does not constitute investment advice, trading advice, or any guarantee of returns.