U.S. Consumer Confidence Due Tonight — UMich's May Final Already Hit an All-Time Low of 44.8
The Conference Board releases its May Consumer Confidence Index tonight at 10 a.m. ET — and it follows a brutal UMich final reading of 44.8, the lowest in the survey's 74-year history. Together, these two prints will shape the Fed's June rate-path narrative.

TL;DR
The Conference Board (CB) releases its May Consumer Confidence Index tonight at 10 a.m. ET. UMich already went first — its May final came in at 44.8, the lowest reading since the survey launched in 1952.
- UMich May final: 44.8, revised down from a preliminary 48.2 — the third consecutive monthly decline
- One-year inflation expectations rose to 4.8%; long-run expectations (5–10 yr) climbed to 3.9% — the highest since 1991
- 57% of respondents volunteered that high prices are straining their finances — a record share
- Together, these two prints will determine whether the Fed begins laying the groundwork for a June cut — or holds the line
The Conference Board releases its May Consumer Confidence Index tonight at 10 a.m. ET. One week before that release, the University of Michigan already showed its hand: the May final came in at 44.8, revised down 3.4 points from the preliminary 48.2. That is the lowest reading in the UMich series going back to 1952.
The two surveys measure slightly different things, but they're pointing in the same direction: American consumers have moved from "worried about prices" to "cutting back on spending plans." Tonight's CB print will set the tone for the first wave of SPY and QQQ pricing at the open.
UMich vs. Conference Board: What's the Difference
The two consumer confidence surveys are often conflated. Here's how they split.
University of Michigan Consumer Sentiment — the longest-running consumer survey in the U.S., dating to 1952. It polls roughly 500 households, releases a preliminary reading early in the month and a final at month-end, and focuses on current conditions plus one-year-ahead expectations. Markets treat it as the pulse of the American household. The May final of 44.8 — the all-time low — comes from this series.
Conference Board Consumer Confidence Index — released about a week after UMich, with a larger sample of 3,000 households. It breaks out three components: assessment of current conditions, expectations for the next six months, and views on the labor market. Markets read it as a combined gauge of consumer spending and employment sentiment. Tonight's release is the CB's May reading.
The two indices generally move together but can diverge by 5–10 points in absolute level. The key question tonight is whether the CB print also falls to a historic low. If it does, markets will treat the collapse in confidence as confirmed signal — not noise from a single survey.
What 44.8 Actually Tells Us
UMich's May final of 44.8 is more than 10 points below the 2008 financial-crisis trough (55.3) and 5 points below the 2022 inflation-crisis low (50.0). This level is genuinely without precedent.
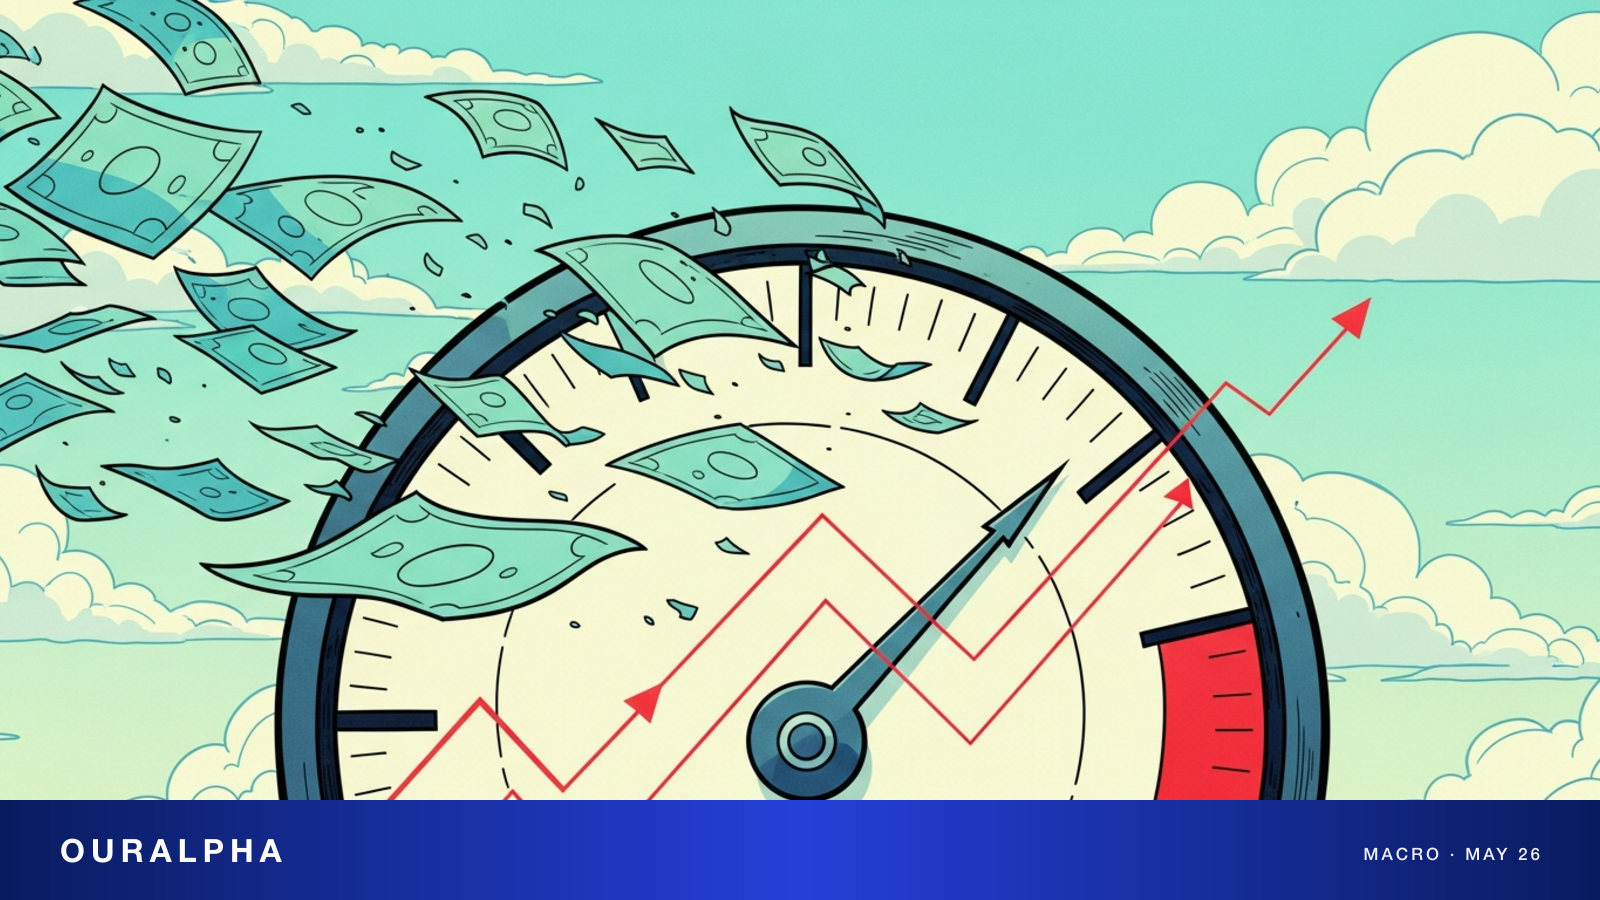
The more consequential detail is inflation expectations. One-year expectations rose to 4.8%; long-run expectations (5–10 years) climbed to 3.9% — the highest since 1991. That means ordinary American households are no longer treating inflation as transitory. They're budgeting for roughly 4% inflation indefinitely.
Why does that matter? Because the Fed's single biggest concern is whether long-run inflation expectations remain anchored near 2%. Once that anchor slips, the Fed is forced to delay rate cuts — even if the actual inflation data keeps trending lower.
Another signal buried in the survey: 57% of respondents volunteered — without being asked — that high prices are eroding their financial situation. That's the highest share in UMich's history. The distinction between volunteering and answering a direct question matters: the former means this is dominating kitchen-table conversations across the country.
Does 4.8% Inflation Expectation Tie the Fed's Hands?
The June FOMC meeting is the next critical marker. Before the UMich May data dropped, fed funds futures were pricing roughly a 25% chance of a June cut and ~65% for September. After the UMich release, those probabilities slid to 18% and 55%, respectively. If tonight's CB print also comes in near historic lows, September odds could fall below 50%.
Here's the counterintuitive part that markets often misread: weak consumer confidence is actually delaying rate cuts, not accelerating them.
The logic chain: Confidence collapses + inflation expectations rise → Fed grows more worried about unanchoring long-run expectations → Fed must keep its policy stance hawkish → rate cuts get pushed out.
If confidence were collapsing without inflation expectations rising, that's a clean recession signal and the Fed would cut faster. But the May data delivered both ends simultaneously, putting the Fed in a genuine bind.
The market impact is tiered:
- Rate-sensitive sectors (small-caps, REITs, highly leveraged utilities): most directly pressured
- Large-cap AI names (Mag 7, AI hardware supply chain): relatively insulated — their earnings growth runs on its own track, largely independent of the macro rate environment
- Staples and healthcare defensives: relatively advantaged in a low-confidence environment
Three Things to Watch in the Next 48 Hours
The 48-hour window after tonight's release is when the market recalibrates its Fed rate-path assumptions. Three things to track:
1. Where the CB number actually lands. Consensus is 88 (April was 86; a modest bounce was expected). A print below 85 — or worse, below 80 — would confirm the UMich direction and cement "confidence collapse" as the dominant narrative. A print above 90 would flip the script: markets would treat UMich as noise and lean on the CB read.
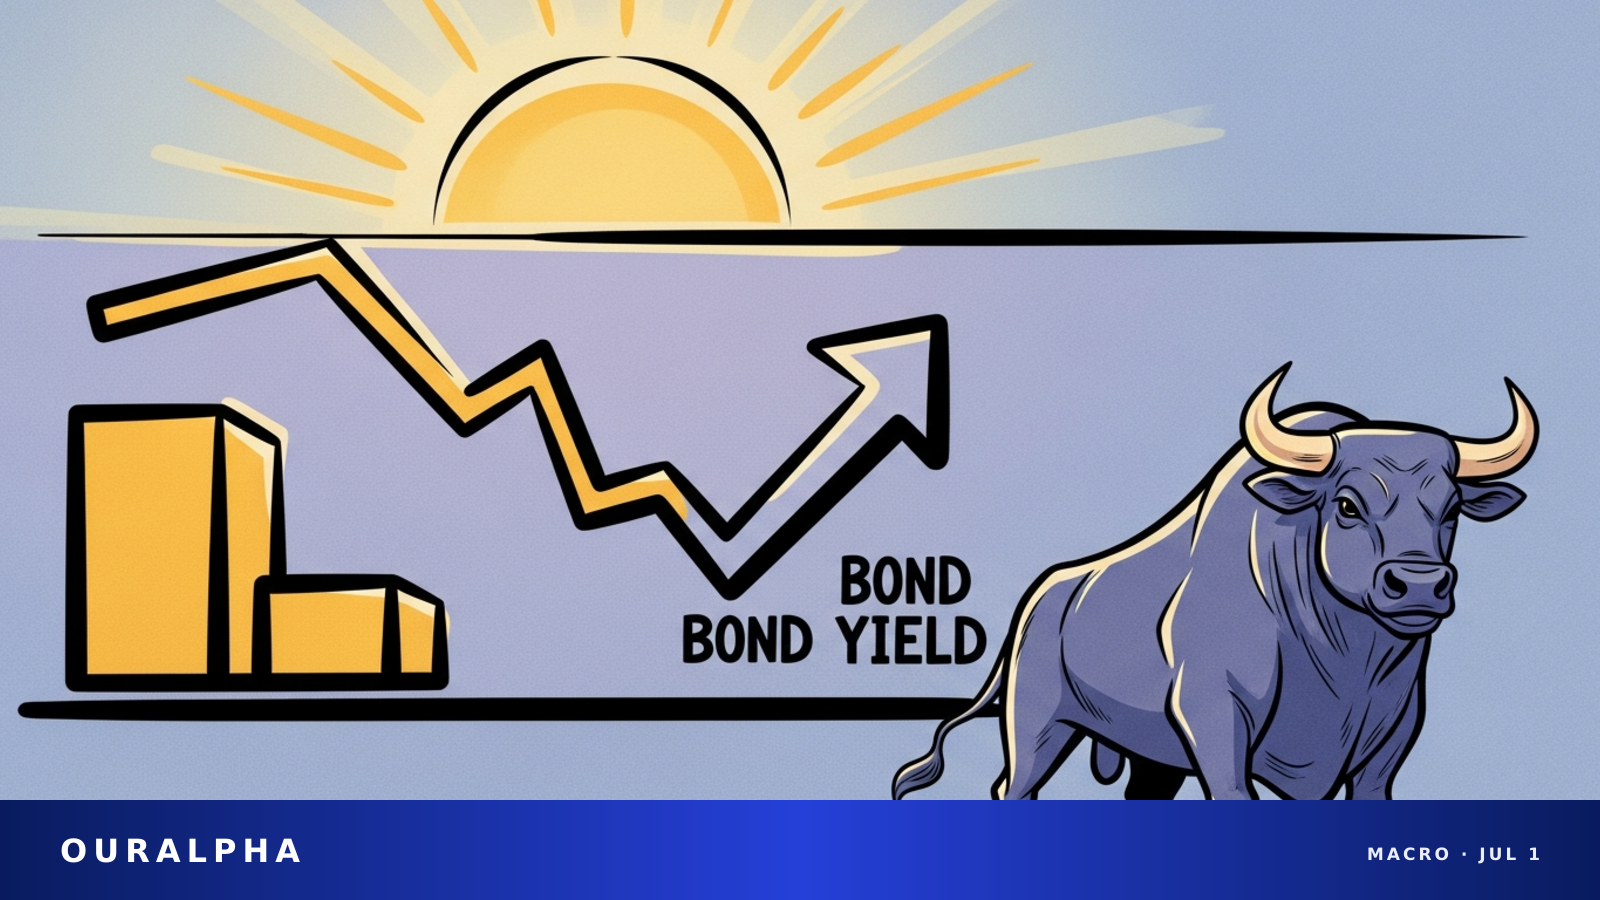
2. The 10-year Treasury yield. This is the cleanest thermometer for reading whether the market is pricing recession risk or inflation risk. CB weak + yields falling = recession fears dominating (bearish for equities, bullish for bonds). CB weak + yields rising = inflation fears dominating (bearish for both). The latter is the hardest scenario to manage — and right now it's the base case.
3. XRT and XLY relative to XLP. The wider XLP outperforms XRT, the more the market is pricing actual pullback in consumer spending. If that spread widens sharply after tonight's print, it's a clear signal to trim discretionary exposure and rotate into defensives.
The single cleanest real-time gauge: the direction of the 10-year yield in the 24 hours following tonight's release. Lower → recession framework in control; AI megacaps hold up relatively well, rate-sensitive sectors catch a bid. Higher → inflation fears dominate; the entire equity market faces another round of multiple compression.
Honestly: the combination of these two data points represents the most uncomfortable macro setup of 2026 so far. Which is exactly why you need to watch it closely.
Sources
This content is for informational purposes only and does not constitute investment advice, trading advice, or any guarantee of returns.