Friday's PCE Print Will Make or Break the Fed's June Call
The April PCE report — the Fed's preferred inflation gauge — drops Friday and it's the cleanest macro signal before the June FOMC meeting. Nasdaq, AI names, banks, small caps, and the dollar are all in play.

TL;DR
Friday's April PCE — the Fed's preferred inflation gauge — is the single most direct data point before the June FOMC meeting. Consensus sits at +3.8% headline, +3.3% core, both well above the 2% target. But what markets are really watching is the trend: is core inflation genuinely rolling back over, or has sticky services inflation found a floor?
- The curve currently prices just one cut in H2 2026, with the first fully-priced cut not arriving until September
- Core PCE at 3.2% or below → July cut odds re-enter the picture; AI and small caps lead the rally
- Core PCE at 3.4% or above → first cut pushed to Q4; the "no cuts in 2026" scenario comes back to life
- Five asset classes directly in the crosshairs: Nasdaq / banks / small caps / Treasuries / the dollar
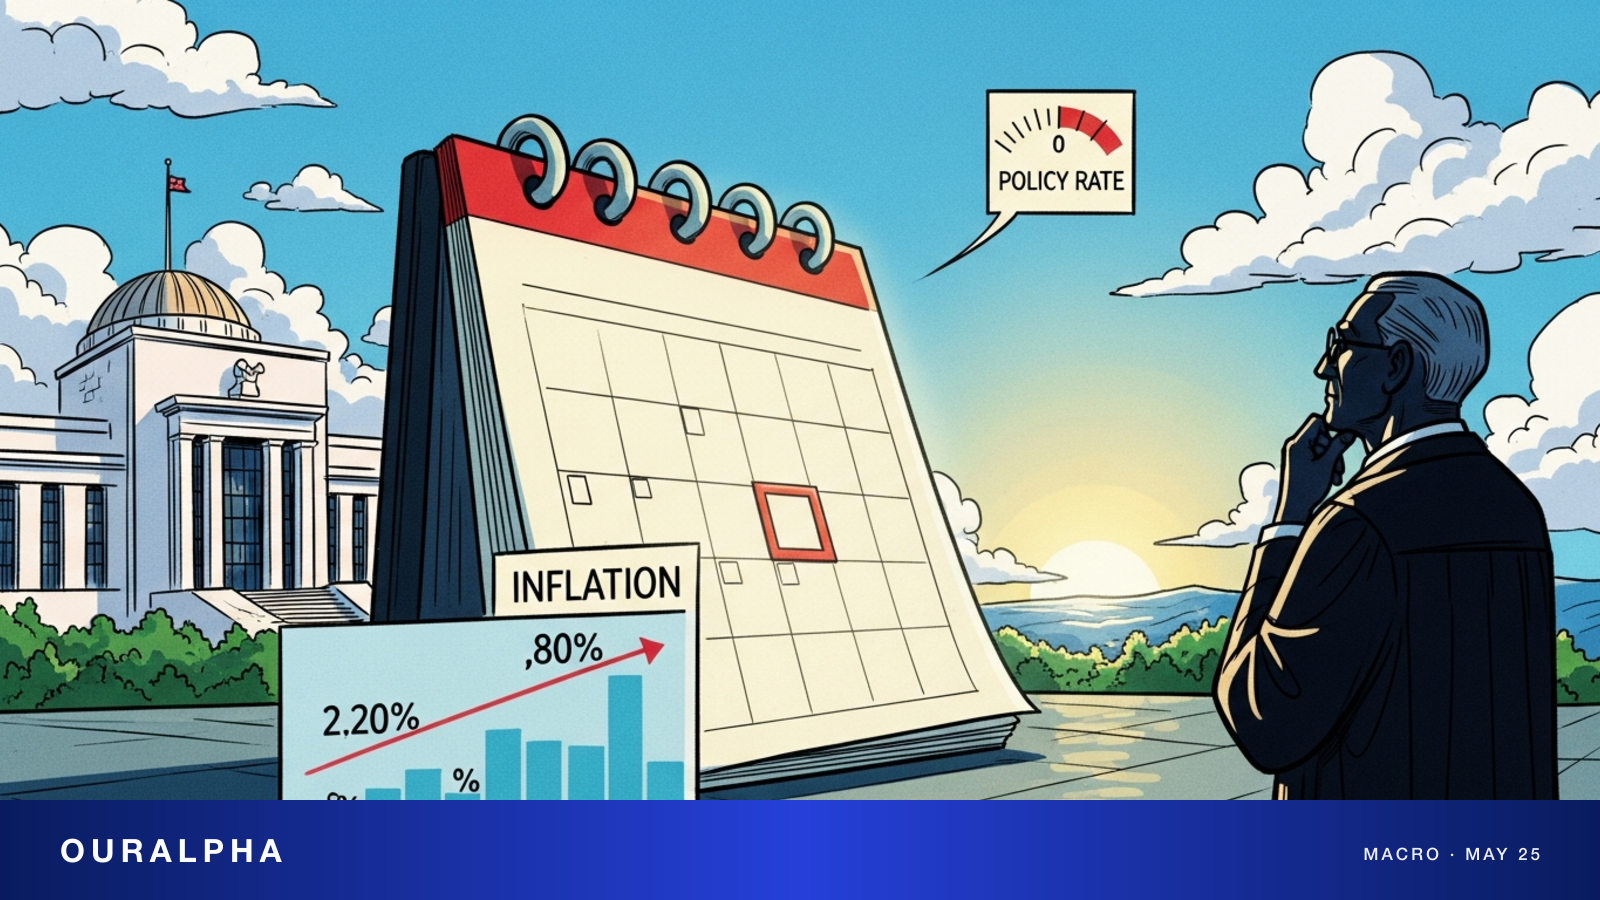
For the past two weeks, markets were held hostage by oil prices and Middle East geopolitics. This week, the macro spotlight swings back to inflation: Friday's April PCE — the Fed's preferred inflation gauge — is the most direct read available before the June FOMC meeting.
Per Barron's, consensus expects April PCE at +3.8% YoY, with core PCE at +3.3%. Both sit well above the Fed's 2% target, but the market won't just be checking the level — it will be reading the trajectory: is core inflation genuinely re-decelerating after a hot Q1, or has sticky services inflation found a floor?
Why This PCE Print Matters
April PCE lands at a peculiar inflection point. After Q1 core inflation surprised to the upside and pushed rate-cut expectations further out the curve, the data flow since May has been mixed: services inflation is showing early signs of cooling, but goods inflation has re-accelerated as oil prices transmitted upstream through supply chains. April PCE is the first read capable of synthesizing these two opposing signals into a single core number — and it will tell markets which force is winning.
For the Fed, breadth matters more than the level. Powell and the FOMC's dovish camp have consistently argued that "even if the year-over-year print looks sticky, the disinflationary path remains intact." Since Warsh's confirmation as incoming chair in May, the hawkish bloc has hardened further — their view is that core services above 3.3% is simply incompatible with the 2% target on any reasonable horizon. Friday's data either resolves that internal divide or deepens it.
Where Positioning Stands
The curve currently prices roughly one cut in H2 2026, with the first fully-priced cut not arriving until September.
- Core PCE at 3.2% or below → the first cut gets pulled forward; a July cut re-enters the probability distribution
- Core PCE at 3.4% or above → first cut shifts to Q4; the "no cuts in all of 2026" scenario resurfaces
Five Asset Classes Directly in Play
1. Nasdaq + high-multiple AI names. Long-duration growth stocks — Nvidia, Microsoft, AMD, Broadcom (AVGO), cloud infrastructure — are the most sensitive to real rates. A softer-than-expected core PCE would compress 10-year real yields and hand the AI complex the most direct tailwind.
2. Banks. The KBW Bank Index and regional bank ETFs face two opposing forces on hot versus cold inflation data — a hotter print delays cuts (good for net interest margins, bad for commercial real estate stress); a cooler print does the reverse. In 2026, banks are more tightly tethered to credit quality signals, but Friday will still drive meaningful intraday moves.
3. Small caps. The Russell 2000 is the most front-end-rate-sensitive index in the market, given small caps' heavy reliance on floating-rate debt. Every 25 bps of curve movement translates directly into refinancing cost differentials. A cooler PCE is an immediate tailwind for IWM's relative performance.
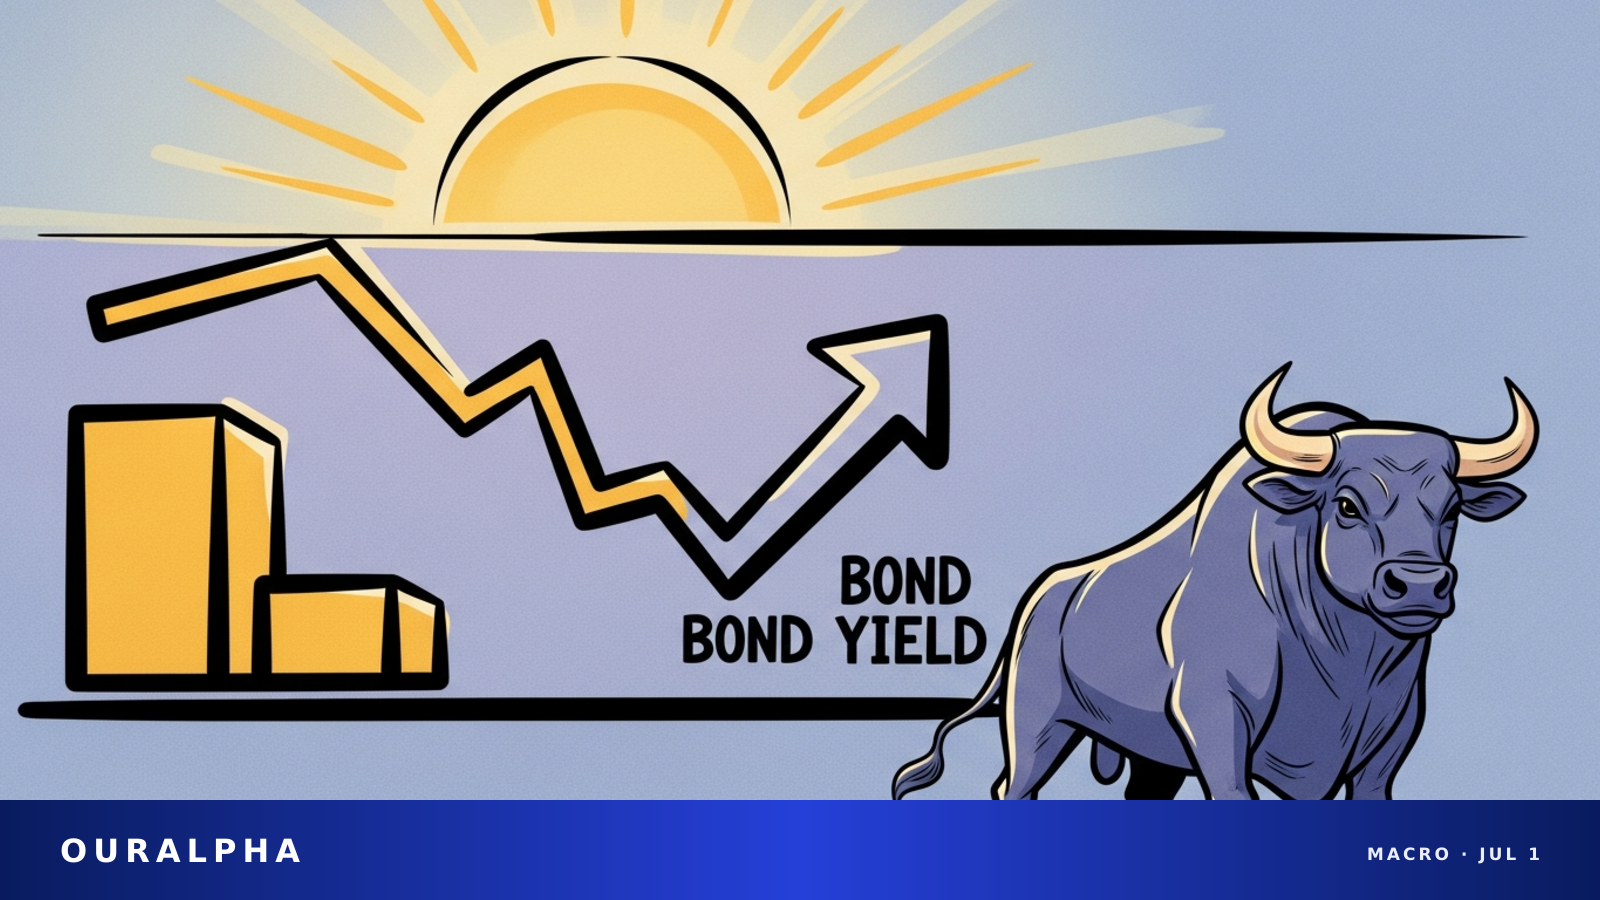
4. The Treasury curve. The direction of the 2-year yield in the first 30 minutes after Friday's release is the cleanest real-time gauge of how far positioning was offside. A move of 5 bps or more signals meaningful consensus miss; a muted reaction means the market had it roughly right.
5. The dollar. The DXY is the cleanest macro vol-compression tool in 2026 — it rises when the Fed path turns hawkish, falls when it turns dovish. The dollar's reaction will tell cross-asset traders how the market is interpreting the data before any single equity sector confirms it.
How to Position
The practical framework: April PCE is the most direct signal before June FOMC, but the Fed has repeatedly emphasized it is "looking at the cumulative data, not any single number." That means Friday's print will shape the H2 rate path narrative more than it will force the Fed's hand at the June meeting itself.
The base case is core PCE printing near the 3.3% consensus — markets read it as "gradual disinflation confirmed, no urgency to act," and the week closes roughly flat.
The asymmetry on either side is meaningful:
- A 3.1% print likely triggers a 1–2% rally, with AI names and small caps leading
- A 3.5% print likely triggers a 1–2% selloff, with the same cohort leading the decline
For investors already positioned, there's no need to take a directional bet before Friday's open. The more sensible approach this week: hold core large-cap quality exposure and carry hedged positioning in small caps or banks, then adjust once the data lands.
Five Things to Watch This Week
Tuesday: Post-holiday spot reaction to the Iran diplomatic developments and oil prices.
Wednesday: Q1 GDP revision, plus the Atlanta Fed's second read on Q2 growth.
Thursday: Initial jobless claims. Market sensitivity to this print has quietly risen in 2026 as labor market normalization enters a critical phase.
Friday: PCE itself, immediately followed by the final University of Michigan inflation expectations reading.
The bond market's reaction in the 60 minutes after Friday's data. A meaningful move in 2-year yields confirmed by a simultaneous dollar move signals the data materially shifted the Fed path narrative. If both stay quiet, the consensus was right — and markets will pivot their attention to the June meeting itself.
Sources
This content is for informational purposes only and does not constitute investment advice, trading advice, or any guarantee of returns.