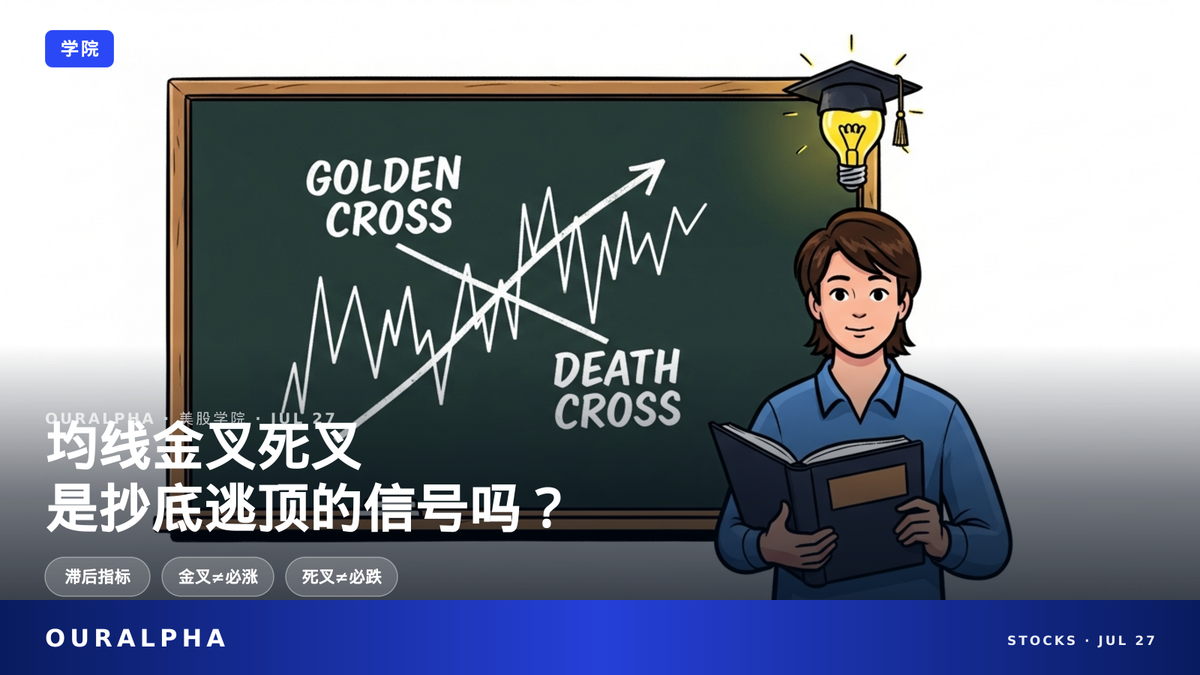
What Are Moving Average Golden Cross and Death Cross? Usage and Risks Explained

Moving average Golden Cross and Death Cross are common technical analysis signals, but they are lagging indicators and cannot predict the future. This article explains the principles, usage, and risks in plain English to help beginners avoid common pitfalls.

What Are Moving Average Golden Cross and Death Cross? Usage and Risks Explained
OURALPHA · ACADEMY

Moving Average Golden Cross & Death Cross:
Are They Signals to Buy the Dip or Sell the Top?

OurAlpha Academy · Technical Indicators for Beginners

Golden Cross and Death Cross are the most common moving average signals in technical analysis. They sound powerful, but do you really know how to use them?

They are actually lagging indicators—they only confirm a trend after it has happened, not predict the future.

This article explains the principles, usage, and common pitfalls in plain English, so you won't be fooled by the names.

TL;DR · IN SHORT

  • Golden Cross = short-term moving average crosses above long-term moving average, a bullish signal. Death Cross = short-term moving average crosses below long-term moving average, a bearish signal.
  • But both are lagging indicators, calculated from past prices. They only confirm a trend that has already started, not predict the future.
  • Don't make buy/sell decisions based solely on Golden/Death Cross. Combine with volume, other indicators, or fundamental analysis for confirmation.
  • In a sideways market, moving average crossovers often produce false signals, known as 'whipsaws'.

KEY TERMS

SMA (Simple Moving Average): The arithmetic average of closing prices over the past N trading days, updated daily to smooth price fluctuations.

EMA (Exponential Moving Average): A moving average that gives more weight to recent prices, reacting faster than SMA.

Golden Cross: When a short-term moving average (e.g., 50-day) crosses above a long-term moving average (e.g., 200-day), seen as a bullish signal.

Death Cross: When a short-term moving average (e.g., 50-day) crosses below a long-term moving average (e.g., 200-day), seen as a bearish signal.

CONTENTS

  1. What Is a Moving Average and Why Is It Called 'Moving'?
  2. What's the Difference Between SMA and EMA? Which Should I Use?
  3. What Do Golden Cross and Death Cross Signal?
  4. Does a Golden Cross Guarantee a Rise? Does a Death Cross Guarantee a Fall?
  5. What Are the Common Risks of Moving Average Golden/Death Cross?
  6. How to Use Moving Average Golden/Death Cross Correctly?
  7. Are Moving Average Golden/Death Cross Suitable for Beginners?
  8. FAQ

What Is a Moving Average and Why Is It Called 'Moving'?

A moving average (MA) is simply the average of the closing prices over the last N trading days. You calculate it each day and connect the dots to form a line. Because the data updates every day—adding the newest day and dropping the oldest—the line 'moves,' hence the name.[1]

For example, a 10-day SMA is the arithmetic mean of the last 10 closing prices. Say the past 10 closing prices are 10, 11, 12... 20. Add them up and divide by 10 to get 15—that's today's 10-day SMA. Tomorrow, you add the 11th day's price and drop the 1st day's price, recalculate the average, and the line 'moves.'[2]

The core purpose of a moving average is to filter out short-term price noise, giving you a clearer view of the trend direction. It's like blurring a photo on your phone—you see the overall shape better. Reading candlestick charts follows a similar idea: see the big picture first, then analyze details.

You might ask: why average? Why not just look at daily closing prices? Because a single day's price can jump around due to sudden news or large trades, making it hard to see the true direction. A moving average smooths out those short-term fluctuations, revealing the long-term trend. For instance, if a stock drops 5% today but has been rising overall over the past 20 days, the 20-day moving average still points up, so you won't mistake that one-day drop for a trend reversal.

What's the Difference Between SMA and EMA? Which Should I Use?

SMA (Simple Moving Average) treats all historical prices equally—it's smoother but lags more. EMA (Exponential Moving Average) gives more weight to recent prices. The formula is EMA = closing price × smoothing factor + previous EMA × (1 - smoothing factor), where smoothing factor = 2/(period + 1). So EMA reacts faster to recent price changes.[3]

Simply put: SMA is like a slow, steady ox—stable but slow to react. EMA is like a quick cheetah—fast but easily disturbed by short-term noise. Short-term traders often use EMA, while long-term trend followers prefer SMA.[4]

For beginners, I recommend starting with SMA because it's easier to understand and its long-term signals are more reliable.

Let's deepen with an example: Suppose the last 5 closing prices are 10, 11, 12, 13, 14. The 5-day SMA is (10+11+12+13+14)/5 = 12, each day weighted equally. In the 5-day EMA, yesterday's price has more weight than the day before, and today's price has the most weight. If today's price suddenly jumps to 16, the EMA will move up faster than the SMA because it 'cares' more about today's big move. But if you use EMA, you might mistake a one-time spike for a trend improvement, while SMA stays calmer. So, short-term traders like EMA's sensitivity, long-term investors trust SMA's stability.

What Do Golden Cross and Death Cross Signal?

A Golden Cross occurs when a short-term moving average (most commonly the 50-day) crosses above a long-term moving average (most commonly the 200-day). It's considered a bullish signal, suggesting the trend may turn from down to up.[6] A Golden Cross typically goes through three stages: ① The downtrend bottoms out as selling pressure exhausts; ② The short-term MA crosses above the long-term MA, confirming the trend reversal (the cross itself); ③ After the reversal is confirmed, the price continues to rise.[7]

A Death Cross is the opposite: the short-term MA crosses below the long-term MA, seen as a bearish signal that the long-term trend may turn negative.[8]

The 50-day and 200-day MAs are most commonly used because 50 days roughly correspond to a quarter's trading days, and 200 days to a year's, making them good for reflecting medium- to long-term trends.[5]

Think of a Golden Cross as 'two lines hugging': the short-term MA (e.g., 50-day) comes from below and crosses above the long-term MA (200-day), forming an upward 'X' that suggests an upward trend. A Death Cross is when the short-term MA crosses below the long-term MA, forming a downward 'X' that suggests a downward trend. Note: this is a crossover of two MAs, not price crossing an MA—many beginners confuse that.

Does a Golden Cross Guarantee a Rise? Does a Death Cross Guarantee a Fall?

Not at all! Despite their absolute-sounding names, Golden and Death Crosses are just historical statistical references, not predictions. According to data cited by Investopedia, the S&P 500 historically averaged a decline of about 7.8% within 6 months after a Death Cross; after a Golden Cross, the S&P 500 historically averaged a gain of about 9.9% within a year—but these are historical averages, not guarantees of future results.[9]

More importantly, moving averages are lagging indicators—they are calculated from past prices. Golden/Death Cross signals often appear only after the price has already reversed for some time. They can only confirm a trend that has already started, not predict future moves.[11]

So, don't rush to go all-in when you see a Golden Cross, or panic-sell at a Death Cross. They are more like a 'heads-up' that the trend may be changing, but you need other signals to confirm.

Here's a counterexample: Suppose a stock drops from 100 to 50, then bounces to 60. At that point, the 50-day MA might just cross above the 200-day MA, forming a Golden Cross. But the bounce could be short-lived, and the stock falls back to 50. If you bought at the Golden Cross, you'd be trapped. Similarly, after a Death Cross, the stock might quickly rebound, creating a 'false Death Cross.' So historical average returns are just statistics; individual trades can go completely the opposite way.

What Are the Common Risks of Moving Average Golden/Death Cross?

The biggest risk is 'false signals,' especially in sideways or choppy markets. When prices fluctuate back and forth, moving average crossovers happen frequently but quickly reverse, causing you to buy just before a drop and sell just before a rise. This back-and-forth whipping is called a 'whipsaw.'[12]

Another risk is over-reliance. Brokerage educational materials commonly warn that technical analysis tools like moving average crossovers should not be the sole basis for investment decisions. They should be combined with volume, other indicators, or fundamental analysis to confirm signals.[14]

Also, beginners often confuse 'MA crossover' with 'price crossing an MA.' Golden/Death Cross is a crossover between two MAs, while price crossing above or below a single MA (e.g., breaking below the 200-day MA) is a different signal—the latter reacts faster but has more noise.[13]

Specifically, in a choppy market, price may swing between the 50-day and 200-day MAs, causing the 50-day MA to repeatedly cross above and below the 200-day MA, creating a series of Golden and Death Crosses. If you buy every Golden Cross and sell every Death Cross, you might lose more than in a trending market. Also, don't mistake price breaking below the 200-day MA for a Death Cross—a Death Cross must involve two MAs crossing, not price and an MA.

How to Use Moving Average Golden/Death Cross Correctly?

First, understand the role of moving averages: they are trend confirmation tools, not prediction tools. Use them to determine whether the current trend is up or down—price consistently above the MA suggests an uptrend, below suggests a downtrend. The MA itself can also act as dynamic support or resistance.[10]

Second, combine with other indicators. For example, when a Golden Cross appears, check if volume is increasing, or use the Relative Strength Index (RSI) to see if the price is 'overbought' (rising too fast, due for a pullback) or 'oversold' (falling too deep, due for a rebound). Don't make decisions based on a single signal.

Finally, consider the market environment. In a clear trending market, MA crossover signals are more reliable. In a choppy market, it's better to reduce reliance on MA crossovers or switch to shorter-term MAs.

For instance, if you see a Golden Cross, first check the volume—if volume is significantly higher on the day of the cross, it suggests money is flowing in, making the signal more credible. If volume is flat, it might be a false breakout. Also, check if the price is also above the 200-day MA—if so, the trend is more solid. If price is still below the 200-day MA, the Golden Cross might just be a bounce, not a reversal.

Are Moving Average Golden/Death Cross Suitable for Beginners?

Yes, as an entry-level tool because they are intuitive and help you build a concept of trends. But the most common mistake beginners make is 'blind faith'—thinking a Golden Cross is a buy signal and a Death Cross is a sell signal, then losing money.

Remember: moving averages are summaries of historical data, not crystal balls. Treat them as a reference, not a holy grail. Technical analysis has its limitations, and investment decisions should also consider fundamentals, risk management, and personal circumstances.[14]

Beginners can start with a paper trading account to practice using Golden/Death Cross signals and see how they perform. You'll find that signals are frequently wrong in choppy markets but perform well in trending markets. Through practice, you'll gradually understand when to trust them and when to be skeptical. Eventually, combine MAs with other tools to build your own trading system.

常见问题 FAQ

Can moving average Golden/Death Cross be used as the sole basis for buy/sell decisions?

Not recommended. MA crossovers are lagging indicators and prone to false signals, especially in choppy markets. It's best to combine with volume, other technical indicators, or fundamental analysis for confirmation.[14]

What's the difference between price crossing above/below an MA and a Golden/Death Cross?

Price crossing above/below an MA refers to the price itself crossing a single MA (e.g., breaking above the 200-day MA). Golden/Death Cross is a crossover between two MAs. The former reacts faster but has more noise; the latter is more lagging but has stronger trend significance.[13]

How to choose MA periods? Are 50-day and 200-day the best?

50-day and 200-day are the most common for medium- to long-term, but not absolute. Short-term traders might use 5-day, 10-day, 20-day; long-term investors might use 100-day, 200-day. The key is to choose based on your trading style and be consistent.

Which is more accurate, SMA or EMA?

There's no 'more accurate'—it depends on the purpose. SMA is smoother and lags more, suitable for long-term trends. EMA reacts faster, suitable for short-term. Beginners are advised to start with SMA.[4]

Can Golden/Death Cross only be used on daily charts? Do they work on weekly or monthly charts?

Yes, the principle is the same, but the K-line period changes. Weekly/monthly Golden/Death Crosses cover longer timeframes, making signals more stable but also later to confirm. Daily crossovers appear earlier, giving faster warnings but with more false signals. Beginners can start with daily charts to get familiar, then use weekly charts to confirm the larger trend.

How to avoid false MA signals in a sideways market?

In a sideways market, MA crossovers are prone to 'whipsaw' false signals. It's advisable to reduce the use of MA crossovers, or combine with oscillators like Bollinger Bands, or simply wait for the trend to become clear before trading.[12]

Do moving average Golden/Death Cross work for all stocks?

MAs work for stocks or indices with sufficient historical data. For illiquid or highly volatile stocks, MA signal reliability decreases. Index signals like the S&P 500 are usually more reliable than individual stocks.

SOURCES

[1] Investopedia - Moving Average (MA)
[2] Charles Schwab - How to Trade a Simple Moving Average
[3] Investopedia - Exponential Moving Average (EMA)
[4] Fidelity - What Is EMA? Exponential Moving Average
[5] CME Group - Understanding Moving Averages
[6] Investopedia - Golden Cross
[7] Investopedia - Golden Cross
[8] Investopedia - Death Cross
[9] Investopedia - Death Cross
[10] CME Group - Support and Resistance
[11] Investopedia - Lagging Indicator
[12] Investopedia - Whipsaw
[13] Charles Schwab - How to Trade a Simple Moving Average
[14] Charles Schwab - How to Trade a Simple Moving Average

This content is for informational purposes only and does not constitute investment advice, trading advice, or any guarantee of returns.

Keep Reading

MACD Indicator Explained: Golden Cross, Death Cross, Divergence, and Practical Use

MACD Indicator Explained: Golden Cross, Death Cross, Divergence, and Practical Use
OURALPHA · ACADEMY

What Is the MACD Indicator?
A Beginner's Guide to Buy/Sell Signals and Common Pitfalls

OurAlpha Academy · Understanding Technical Indicators from Scratch

Many beginners treat MACD golden cross/death cross as a magic buy/sell signal, only to get whipsawed repeatedly in choppy markets.

MACD is inherently a lagging indicator—based on historical moving averages, so by the time a signal appears, the trend may already be halfway through.

Understanding its principles and limitations helps you use it as a supporting tool, not

Read full story →

Stay ahead of the market — never miss a deep dive

Follow OurAlpha for AI-driven US equity research and market insight, every day.