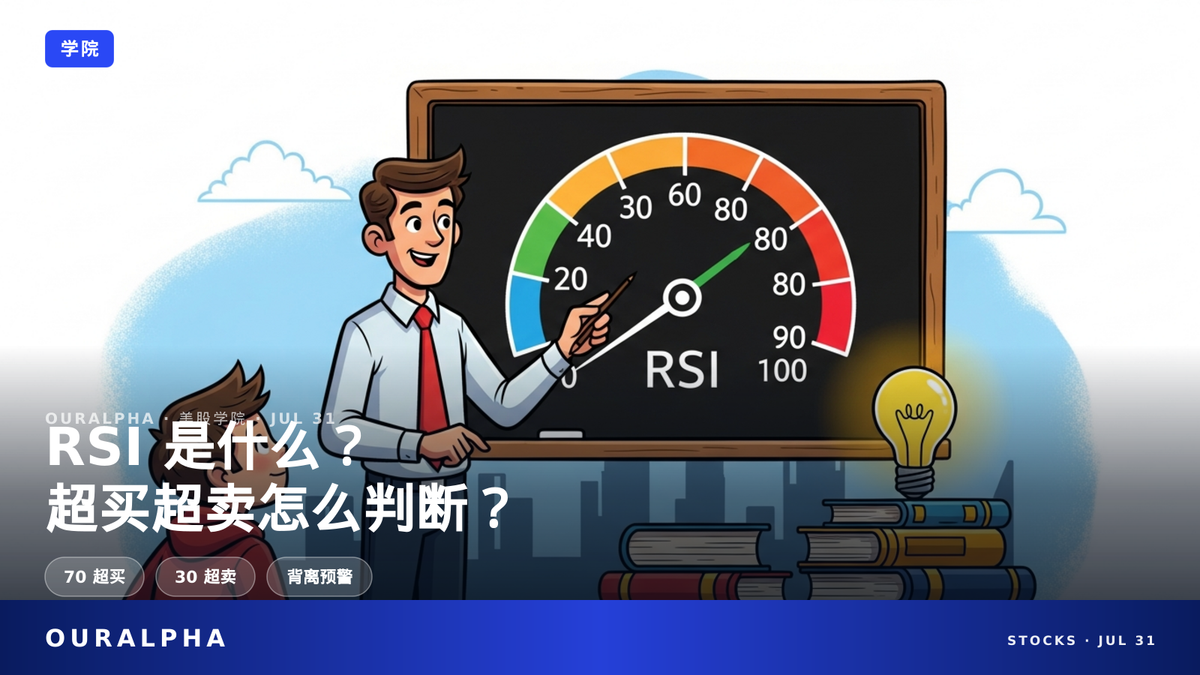
What Is RSI? Overbought/Oversold Judgment and Misconceptions Explained
What is RSI? 70 overbought, 30 oversold, but following that blindly can lose money? This article explains RSI principles, divergence, and common misconceptions in plain English.
What Is RSI?
How Do You Actually Judge Overbought and Oversold?
Open any trading app and RSI is everywhere, but do you really understand it?
70 overbought, 30 oversold—just buy and sell by the numbers? Big mistake.
This article explains RSI's principles, usage, and the most common pitfalls in plain English.
To truly understand RSI, start by breaking the 70/30 superstition.
TL;DR · IN SHORT
- RSI measures the strength of price moves, from 0 to 100; 70 is overbought, 30 is oversold.
- Overbought doesn't mean a drop is coming—in strong trends, RSI can stay overbought for a long time.
- RSI divergence is a more reliable warning sign, but it should be used with other tools.
KEY TERMS
RSI (Relative Strength Index): A momentum oscillator introduced by J. Welles Wilder in 1978, ranging from 0 to 100, measuring the relative strength of recent gains versus losses, often used to identify overbought or oversold conditions.
Overbought: When RSI rises above 70, it's often considered overbought, meaning the recent upward momentum may be too strong and a pullback is possible, but it's not a definite sell signal.
Oversold: When RSI falls below 30, it's often considered oversold, meaning the recent downward momentum may be too strong and a bounce is possible, but it's not a definite buy signal.
Divergence: When price and RSI move in opposite directions, such as price making a new high but RSI not making a new high (bearish divergence), often interpreted as a warning that the trend's momentum is weakening.
CONTENTS
What Exactly Is RSI?
In simple terms, RSI (Relative Strength Index) is an indicator that measures how strongly a stock has been rising or falling recently. It was introduced by technical analyst J. Welles Wilder Jr. in 1978[1]. Its value is fixed between 0 and 100[2]—the higher the number, the stronger the recent gains; the lower, the steeper the losses.
Think of it as a thermometer: a high RSI means the market is running a fever (too much upside), while a low RSI means it's freezing (too much downside). But a high fever doesn't always break right away, and being cold doesn't mean it will warm up immediately—this is where many people misuse RSI.
Why can RSI measure the strength of price moves? Its core idea is: over a certain period, if the size and frequency of gains are greater than losses, market sentiment is bullish, so RSI tends to be high; otherwise, it tends to be low. Unlike moving averages, which reflect price levels directly, RSI reflects the speed and magnitude of price changes, making it a momentum indicator.
Think of it like a car's speedometer: RSI shows the speed of change, not how far you've traveled. If the car is going fast (high RSI), it might be accelerating, but it could also be approaching a curve where you need to slow down. Similarly, a high RSI doesn't mean the price will definitely drop; it just warns that the rise has been too fast and too steep, so caution is needed.
How Is RSI Calculated?
RSI is calculated in two steps: first, compute the relative strength RS = average gain over a period ÷ average loss over the same period, then normalize it to RSI = 100 - (100 / (1 + RS))[3]. Wilder originally set the standard period to 14 (e.g., 14 days)[4], which is also the default in most software.
For example: if over the past 14 days, the average daily gain is 1% and the average daily loss is 0.5%, then RS = 2, and RSI = 100 - (100 / 3) ≈ 66.7. The closer the value is to 100, the more gains dominate.
The formula may look complex, but the logic is intuitive: RS is the ratio of gains to losses. If gains are larger than losses, RS is greater than 1, so RSI is above 50; otherwise, it's below 50. The normalization just compresses RS (which can theoretically be infinite) into a 0-100 range for easy comparison.
Why 14 periods? When Wilder introduced it in 1978, he chose 14, possibly because 14 days represent two weeks of trading—short enough to avoid too much noise, but long enough to not be too sluggish. Of course, this parameter isn't fixed; you can adjust it to match your trading style, using shorter periods for short-term trading and longer periods for long-term trading.
Note that it uses average gain and average loss, not simply the number of up days versus down days. For instance, if one day gains 5% and another gains 0.1%, the average gain is influenced by the large gain, so RSI reflects the strength of moves, not just the frequency.
What RSI Level Is Overbought? What Is Oversold?
Traditionally, RSI above 70 is considered overbought, and below 30 is considered oversold—this is the original standard set by Wilder in 1978[5]. However, some traders widen the thresholds to 80/20 to suit more volatile markets[6].
But note: RSI above 70 or below 30 does not mean you should immediately buy or sell; it just suggests that recent momentum may be overheated[7]. In a strong trend, RSI can stay in overbought territory for a long time without pulling back—for example, if a stock keeps surging, RSI might stay above 80. If you rush to sell just because it's overbought, you might exit too early and miss bigger gains later[8].
Why sometimes widen the thresholds to 80/20? Because different stocks have different temperaments: volatile stocks like tech names often push RSI above 80, so selling at 70 might be too early; while less volatile utility stocks rarely exceed 70, making 70 a more effective overbought signal for them. So thresholds aren't set in stone—it's better to look at the stock's own historical RSI range rather than blindly following 70/30.
More importantly, overbought and oversold describe a zone, not a mandatory action signal—just as water boils at 100°C at sea level but at a lower temperature on a mountain, the boiling point changes with the environment. When you see RSI above 70, don't reflexively sell; first check whether the overall trend is still strong and whether other signals (like price breaking a key support level) confirm, then decide. Similarly, RSI below 30 doesn't mean you should immediately bottom-fish.
What Does the RSI 50 Line Mean?
The 50 line on RSI is often seen as the bull-bear boundary: RSI crossing above 50 is usually interpreted as bullish (gains starting to outpace losses), while crossing below 50 is bearish[9]. You can think of the 50 line as a watershed: above 50, bulls have the upper hand; below 50, bears do.
However, the 50 line itself is not a buy or sell signal; it's more useful for gauging trend strength. For example, in an uptrend, RSI often finds support near 50 on pullbacks, but this isn't guaranteed.
Why is 50 the dividing line? Because when RS = 1, RSI = 50, meaning average gains equal average losses, so buying and selling forces are balanced. Thus, RSI above 50 indicates buyers are in control; below 50, sellers are in control.
In practice, you can watch whether RSI stays above 50. If it does, the market is in a bullish pattern, and pullbacks may offer buying opportunities. Conversely, if it stays below 50, the market is bearish, and rallies may offer selling opportunities. But in a sideways market, RSI may cross 50 frequently, making the signal less meaningful.
A more refined use: when RSI breaks above 50 from below, it could be an early sign of trend strengthening; when it breaks below 50 from above, it could signal weakening. But again, confirm with volume, price patterns, and other tools.
What Is RSI Divergence and How Do You Read It?
RSI divergence occurs when price and RSI move in opposite directions: price makes a new high but RSI doesn't (bearish divergence), or price makes a new low but RSI doesn't (bullish divergence)[10]. Divergence is often seen as a warning that the trend's momentum is weakening.
For example: a stock rises from $10 to $15, and RSI climbs from 70 to 80; then the price rises to $16, but RSI falls to 75—this is bearish divergence, suggesting the upward momentum may be fading. However, divergence signals can also fail in strong trends, so it's best to confirm with other tools.
Why does divergence work? Because RSI measures momentum. If price makes a new high but RSI doesn't, it means the force driving the price up is weakening, like a car still climbing a hill but the gas pedal has been released, so speed isn't keeping up. Similarly, bullish divergence suggests selling pressure is fading, possibly signaling a bottom.
But divergence has limitations: in strong trends, divergence can appear repeatedly while the price continues in the original direction. For instance, in a bull market, prices can keep making new highs even as RSI makes lower highs; if you short based on divergence, you might get trapped. So divergence signals need confirmation, such as price breaking a trendline or moving average.
How to confirm divergence? Typically, after a bearish divergence, if price breaks below a prior low, or RSI falls below 50, the divergence is confirmed, increasing the probability of a decline. Similarly, after a bullish divergence, if price breaks above a prior high, or RSI rises above 50, an advance is confirmed.
What's the Difference Between RSI and MACD? Which Should You Use?
RSI and MACD are both popular indicators, but they focus on different things: RSI is an overbought/oversold oscillator ranging from 0 to 100, generating more frequent short-term signals; MACD is composed of the difference between 12-day and 26-day exponential moving averages, making it a trend-following indicator that excels at confirming direction in strong trends[11].
In short, RSI is good for spotting overheated or oversold moments, while MACD is better for judging whether a trend will continue and whether you can hold a position. The reason is that RSI's values are compressed between 0 and 100, often hitting overbought or oversold zones, so signals are more frequent, making it suitable for ranging markets; MACD's histogram expands or contracts with the trend, so signals are less frequent but better at helping you stay in a position during trending markets. You can use them together: use MACD to confirm the trend direction, then use RSI to find entry points. To learn more about MACD, check out MACD Indicator Explained.
For example, in a ranging market, prices oscillate, and RSI frequently enters overbought or oversold zones, giving you many opportunities to buy low and sell high; meanwhile, MACD's golden crosses and death crosses may appear frequently but without clear direction, leading to losses. In a trending market, RSI stays overbought or oversold for long periods, causing you to exit too early; MACD, on the other hand, can track the trend and help you hold your position.
So, there's no 'better' indicator—only what's more suitable for the current market. Beginners can start with RSI, then learn MACD, and finally combine them.
What's the Difference Between RSI Periods of 14 and 2?
The standard RSI period is 14, but some traders use shorter periods, like RSI(2), which uses 2 periods. This makes RSI more sensitive and volatile, often used for quick entries and exits in short-term trading, but the thresholds usually need to be adjusted to 90/10 instead of the standard 70/30[12].
Shorter periods generate more signals, but also more false signals; longer periods produce smoother signals but react more slowly. Beginners should start with the default 14 and experiment with other parameters once familiar.
Why use 90/10 for RSI(2)? Because with a short period, RSI fluctuates wildly, often reaching above 90 or below 10. If you still use 70/30, overbought and oversold signals would appear too frequently, losing their reference value. So, when using short periods, adjust the thresholds accordingly.
RSI(2) suits ultra-short-term traders, like day traders, who need to quickly catch oversold bounces or overbought pullbacks. But the risk is higher because more signals mean more noise, leading to frequent trading, higher fees, and a greater chance of losses.
Conversely, using longer periods, like RSI(20) or RSI(30), produces smoother signals but reacts slower, making them suitable for medium-to-long-term traders who focus on the big picture rather than short-term fluctuations.
In short, there's no absolute right or wrong in choosing a period; the key is to match it with your trading style and market conditions. You can try different periods on a demo account to see which fits your rhythm before using them in live trading.
常见问题 FAQ
How do I find RSI in a trading app?
In most trading software and apps, you can search for 'RSI' in the 'Technical Indicators' or 'Sub-chart Indicators' list. Once added, a curve ranging from 0 to 100 will appear below the candlestick chart. The software calculates it automatically, so you don't need to do the math yourself.
Is RSI reliable when used alone?
Not very. Using RSI alone can fail in ranging markets or strong trends. It's best to combine it with other tools like moving averages, volume, and candlestick patterns[13].
If RSI is overbought, should I definitely sell?
Not necessarily. Overbought only means upward momentum may be overheated, but in strong trends, RSI can stay overbought for a long time. Selling too early might cause you to miss gains[8].
Does RSI divergence always lead to a reversal?
No. Divergence is just a warning signal, not a guarantee of reversal. In strong trends, divergence can occur multiple times before the price continues in the original direction. It's best to confirm with other indicators[10].
What's the best RSI period setting?
The default 14 is the standard period originally set by Wilder[4] and works for most situations. Short-term traders can try shorter periods (like 2), but they need to adjust thresholds and watch out for false signals[12].
How do RSI and moving averages work together?
You can use moving averages to determine trend direction (e.g., price above the moving average), then use RSI to find overbought or oversold points. For example, in an uptrend, RSI pulling back near 50 might offer a reference. To learn about moving averages, see Moving Average Golden Cross and Death Cross Explained.
SOURCES
[1] Relative Strength Index (RSI) - Investopedia
[2] Relative Strength Index (RSI) - Investopedia
[3] Relative Strength Index (RSI) | ChartSchool - StockCharts.com
[4] Relative Strength Index (RSI) | ChartSchool - StockCharts.com
[5] What is RSI? - Relative Strength Index - Fidelity
[6] What is RSI? - Relative Strength Index - Fidelity
[7] What is RSI? - Relative Strength Index - Fidelity
[8] Mastering the Relative Strength Index (RSI): How to Read it Correctly - CMT Association
[9] Relative Strength Index (RSI) | ChartSchool - StockCharts.com
[10] Relative Strength Index (RSI) | ChartSchool - StockCharts.com
[11] Relative Strength Index (RSI) | ChartSchool - StockCharts.com
[12] RSI(2) | ChartSchool - StockCharts.com
[13] What is RSI? - Relative Strength Index - Fidelity
This content is for informational purposes only and does not constitute investment advice, trading advice, or any guarantee of returns.