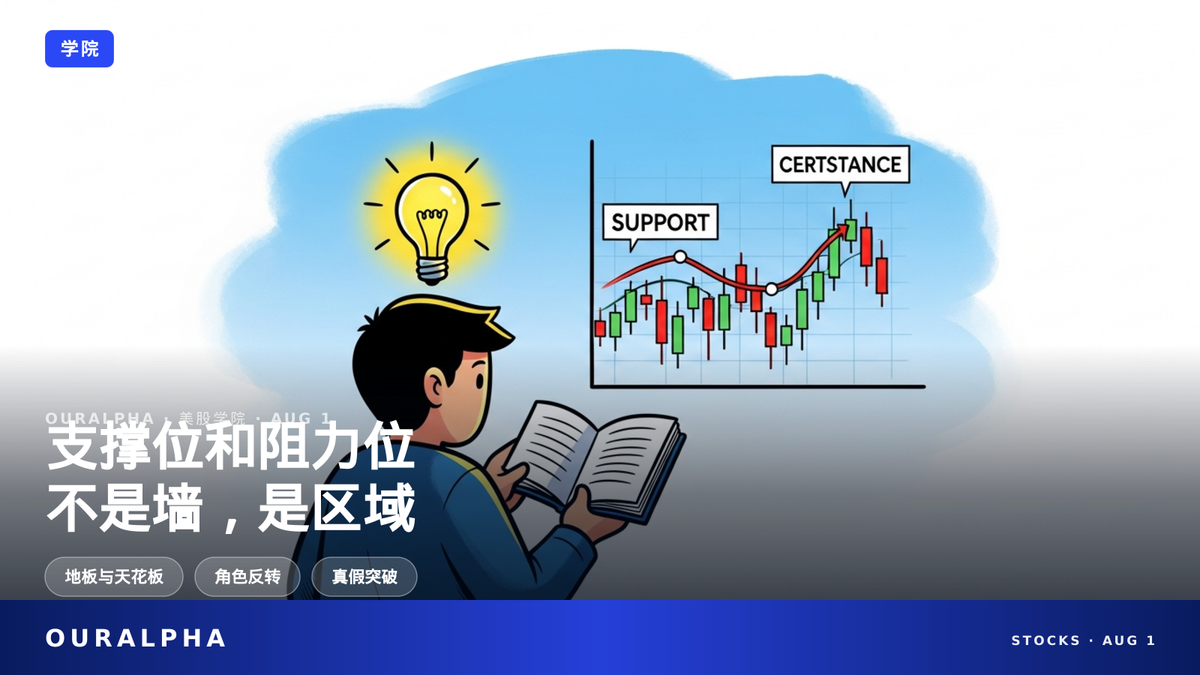
Support and Resistance Levels: What They Are and How to Draw Them
Support and resistance are the foundation of technical analysis, but beginners often mistake them for precise lines. This article explains the concepts, drawing methods, role reversal, and real vs. fake breakouts in plain English.
What Are Support and Resistance Levels?
How Do You Draw Them Correctly?
Support and resistance are two of the most commonly used concepts in technical analysis, but beginners often mistake them for precise lines.
In reality, they are more like price zones, and once they are decisively broken, their roles can flip.
This article uses everyday examples to help you fully understand support and resistance levels.
TL;DR · IN SHORT
- Support acts like a floor, resistance like a ceiling—price levels where buying or selling pressure concentrates.
- Support/resistance are not lines but zones, and they can swap roles after a breakout.
- How to draw: connect highs/lows or use round numbers; a trendline needs at least three touches to confirm.
KEY TERMS
Support: A price level where buying pressure may halt or reverse a downtrend, like a 'floor'.
Resistance: A price level where selling pressure may halt or reverse an uptrend, like a 'ceiling'.
Role Reversal: After a support or resistance level is decisively broken, the old support becomes resistance, and the old resistance becomes support.
Trendline: A sloped line connecting price highs or lows; an uptrend line acts as dynamic support, a downtrend line as dynamic resistance.
CONTENTS
- What exactly do support and resistance mean?
- How do you draw support and resistance? What methods can beginners use?
- Why does support become resistance after being broken?
- Why do round numbers (like $100, $50) tend to become support or resistance?
- Can moving averages (like the 50-day or 200-day) be used as support and resistance?
- How do you tell if a breakout of support or resistance is real or fake?
- How do support/resistance differ from trendlines and channels?
- FAQ
What exactly do support and resistance mean?
Simply put, support is a price level where, during a decline, buying interest (people who want to buy) increases, potentially stopping the fall or even causing a bounce—like a floor holding up the price[1]. Resistance is the opposite: during an advance, selling interest (people who want to sell) increases, potentially stalling or reversing the rise—like a ceiling capping the price[2].
Think of a stock price as a rubber ball: throw it on the floor (support), and it bounces back; throw it at the ceiling (resistance), and it gets pushed back. But the floor and ceiling aren't solid slabs—they're zones where buying and selling pressure concentrate.
Why do these levels work? Because the market is made up of countless traders. When the price falls to a certain level, many who wanted to buy earlier but didn't now think, 'It's cheap,' and start buying. This increased buying pressure stops the decline. Conversely, when the price rises to a certain level, many who wanted to sell but didn't now think, 'I've made enough,' and start selling. This increased selling pressure caps the rise. That's the essence of support and resistance—the result of collective market behavior[3].
Note that support and resistance are not precise lines but 'zones.' Just as a floor isn't perfectly flat and may have a little give, prices may fluctuate around a support level rather than stopping exactly at a point. Similarly, resistance levels can have slight variations. So traders typically view support and resistance as ranges, not points.
How do you draw support and resistance? What methods can beginners use?
The most basic way to draw support and resistance is to look at historical prices: connect a series of lows with a horizontal line for support, and connect highs with a horizontal line for resistance[1][2]. But remember, support and resistance are more like zones than precise lines, and different people may draw them slightly differently[11].
Beginners can start with these methods: look for obvious round numbers (like $100, $50), which tend to become support or resistance due to psychological effects[6]; or use moving averages, such as the 50-day or 200-day MA, which act as support when the price is above and resistance when below[7].
More advanced tools include Fibonacci retracement (commonly using ratios like 23.6%, 38.2%, 50%, 61.8%)[8] and pivot points (calculated from the previous day's high, low, and close)[9].
When drawing trendlines, the basic rule is: you can draw a trendline with just two highs or lows, but you need at least three touches to confirm its validity. An uptrend line connects two or more successively higher lows and acts as dynamic support; a downtrend line connects two or more successively lower highs and acts as dynamic resistance[5].
For beginners, it's best to start with simple horizontal support and resistance: take a historical candlestick chart, mark the obvious turning points with a pen, and see how the price reacts at those levels. Then flip through several more charts to compare. With practice, you'll get better at spotting key levels at a glance. Remember, the strength of support or resistance depends on how many times it's tested: the more times the price tests the same level, the more 'important' (stronger) that support or resistance becomes[3].
Why does support become resistance after being broken?
This is called 'Role Reversal.' When support is decisively broken, traders who bought at that level are now trapped in losing positions. When the price bounces back to that level, they may rush to sell to break even, turning that level into new resistance[4]. Conversely, when resistance is broken, traders who sold at that level may regret it and want to buy back, turning that level into new support.
To confirm a reversal is valid, the price usually needs to make a 'substantial move' through the level; a common rule of thumb is about 3%, otherwise it might be a false breakout[4].
For example: suppose a stock has strong support at $50, and every time it falls near $50, it bounces. But one day, the price breaks below $50 and continues down to $45. Now, investors who bought at $50 are losing money. When the price rebounds to $50, these investors think, 'Finally, I'm back to even—let me sell!' So selling pressure emerges, and $50 turns from support into resistance.
Conversely, if a stock faces resistance at $100 and repeatedly fails to break above it, but one day the price breaks through $100 on high volume and rises to $110, those who sold at $100 will regret it. When the price pulls back to $100, they think, 'This time I'm buying back!' So buying pressure emerges, and $100 turns from resistance into support.
Why do round numbers (like $100, $50) tend to become support or resistance?
This is called the 'Round Number Effect.' Because round numbers are easy to remember and psychologically important, when the price falls toward a round number, buying pressure increases, making it hard to break below; when it rises toward a round number, selling pressure increases, making it hard to break above[6].
For instance, when a stock falls near $100, many people think, 'This is cheap,' and start buying, creating support. When it rises to $100, many think, 'Time to sell,' creating resistance.
Why do round numbers have this power? Because the human brain has a preference for processing numbers, and round numbers are easier to remember and focus on. When placing orders, traders also tend to put buy orders just below a round number and sell orders just above it, further reinforcing the support and resistance at these levels.
Common round numbers include 10, 50, 100, 1000, and other levels ending in zero. For high-priced stocks, there may also be 1000, 2000, etc. These levels often become psychological 'anchors' for the market, and even without fundamental justification, they can trigger collective action.
Can moving averages (like the 50-day or 200-day) be used as support and resistance?
Yes. Moving averages act as dynamic support and resistance: when the price is above the MA, it often acts as support; when below, it often acts as resistance[7].
In particular, the 50-day and 200-day MAs are watched by many traders, creating a 'self-fulfilling' effect—everyone watches these lines, so prices do tend to bounce or stall there. The crossover of the 50-day and 200-day MAs is also called the 'golden cross' and 'death cross,' which are important technical signals. To learn more, check out our article on Moving Average Golden Cross and Death Cross.
The principle behind MAs as dynamic support and resistance is that an MA represents the average cost of investors over a period. When the price is above the MA, most holders are in profit and tend to hold or add, creating support. When the price is below the MA, most holders are at a loss, and when the price rebounds to the MA, trapped sellers emerge, creating resistance.
For example, if a stock's 200-day MA is at $80, and the price falls from $100 to $85, approaching the 200-day MA, there may be significant buying because many think, 'The long-term trend isn't broken; a dip to the MA is an opportunity.' Conversely, if the price rebounds from $60 to $80, approaching the 200-day MA, those trapped earlier will rush to sell, causing the price to stall.
How do you tell if a breakout of support or resistance is real or fake?
The key is volume. A real breakout is usually accompanied by high volume—meaning the volume on the breakout day is significantly higher than the recent average, indicating strong capital pushing the price through the key level. A fake breakout often happens on low volume, with the price briefly crossing the level and then quickly falling back into the original range[11].
Additionally, you can wait for the price to hold above or below the key level for a period (e.g., several consecutive daily closes above resistance) before confirming the breakout, to avoid being fooled by a fake breakout.
For example: a stock has strong resistance at $50 and has repeatedly failed to break above. One day, the price breaks above $50 on high volume, with volume twice the previous days, and closes firmly above $50. The next day, the price continues to rise and doesn't fall back below $50. This is usually considered a real breakout. Conversely, if the price just gaps up slightly above $50 but volume doesn't increase significantly, and it falls back below $50 during the day, it's likely a fake breakout.
Fake breakouts often occur at key levels because major players may use them to lure in buyers or sellers. For example, they might fake a breakout above resistance to attract retail buyers, then quickly dump the price, trapping those buyers at high levels. So, when you see a breakout, don't rush in—first check whether volume confirms it and whether the price can hold.
How do support/resistance differ from trendlines and channels?
A trendline is a sloped support or resistance: an uptrend line connects successively higher lows and acts as dynamic support; a downtrend line connects successively lower highs and acts as dynamic resistance[5]. A price channel consists of two parallel lines: the upper line drawn along resistance and the lower line along support. When the price moves within the channel, the lower line is support and the upper line is resistance[10].
In short, support/resistance are horizontal key levels, trendlines are sloped dynamic levels, and channels are a combination of both. They are all tools in technical analysis, distinct from fundamental valuation (like P/E ratio), and are often used together[12]. For a deeper dive into candlesticks, see How to Read Candlestick Charts.
Trendlines help capture the direction of a trend. An uptrend line connecting two or more successively higher lows shows that buyers are in control, and each pullback to the trendline is a buying opportunity. A downtrend line connecting two or more successively lower highs shows that sellers are in control, and each rally to the trendline is a selling opportunity.
Price channels provide a clearer trading framework. When the price is within a channel, traders can buy near the lower line (support) and sell near the upper line (resistance) until the price breaks out of the channel. Channels can be horizontal or sloped; sloped channels combine the features of trendlines and horizontal support/resistance.
Remember, these tools are not infallible; they are just references to improve a trader's odds. Technical analysis focuses on the battle between buying and selling forces as reflected in historical price action, not on evaluating a company's fundamental value. Therefore, traders often use it alongside fundamental analysis rather than as a substitute[12].
常见问题 FAQ
Are support and resistance levels exact prices?
No, they are more like price zones rather than precise lines. Different people may draw slightly different support/resistance levels because they use different time frames and highs/lows[11].
How many points are needed to confirm support or resistance?
For trendlines, two points can draw a line, but at least three touches are needed to confirm its validity[5]. For horizontal support/resistance, it depends on how many times the price touches the level; the more touches, the more important it is[3].
Can support and resistance predict stock price movements?
No, they only reflect historical zones of concentrated buying and selling, and cannot predict future price movements. Technical analysis focuses on price action, not on evaluating a company's fundamental value, and should be used in conjunction with other analysis[12].
Since they can't predict price movements, how can support and resistance be used in actual trading?
They are more useful as reference points for trading and risk management rather than as prediction tools: for example, consider buying near support, taking profits near resistance, or placing a stop-loss below support—if the price breaks below, it suggests your original assessment may be wrong[10].
What is the difference between support/resistance and moving averages?
Support/resistance are horizontal key levels, while moving averages are dynamic support/resistance that move with the price. MAs like the 50-day or 200-day are widely watched and can create a self-fulfilling effect[7].
How do you use Fibonacci retracement?
Take a high and low of a price move and draw horizontal lines at key Fibonacci ratios (like 23.6%, 38.2%, 50%, 61.8%). Prices often find support or resistance near these levels[8].
What is the relationship between support/resistance and MACD?
MACD is a trend indicator, a different tool from support/resistance. MACD golden cross and death cross can help confirm trends, but support/resistance more directly reflect price levels. They can be used together; see MACD Golden Cross and Death Cross.
SOURCES
[1] Support (Support Level) Definition - Investopedia
[2] Resistance (Resistance Level) Definition - Investopedia
[3] Support and Resistance Basics - Investopedia
[4] Support and Resistance Basics - Investopedia
[5] Trendline Definition - Investopedia
[6] The Round Number Effect - Investopedia
[7] Finding Support and Resistance in Moving Averages - StockCharts ChartSchool
[8] Fibonacci Retracement Definition - Investopedia
[9] Pivot Points - Corporate Finance Institute
[10] Trading Channel - Corporate Finance Institute
[11] Support and Resistance - Fidelity Learning Center
[12] Support and Resistance Basics - Investopedia
This content is for informational purposes only and does not constitute investment advice, trading advice, or any guarantee of returns.