What Are Bollinger Bands? Explanation, Parameters, and Common Misconceptions

Bollinger Bands are not an overbought/oversold indicator but a volatility indicator. Touching a band doesn't mean a reversal, and a squeeze hints at a big move but not the direction.

What Are Bollinger Bands? Explanation, Parameters, and Common Misconceptions
OURALPHA · ACADEMY

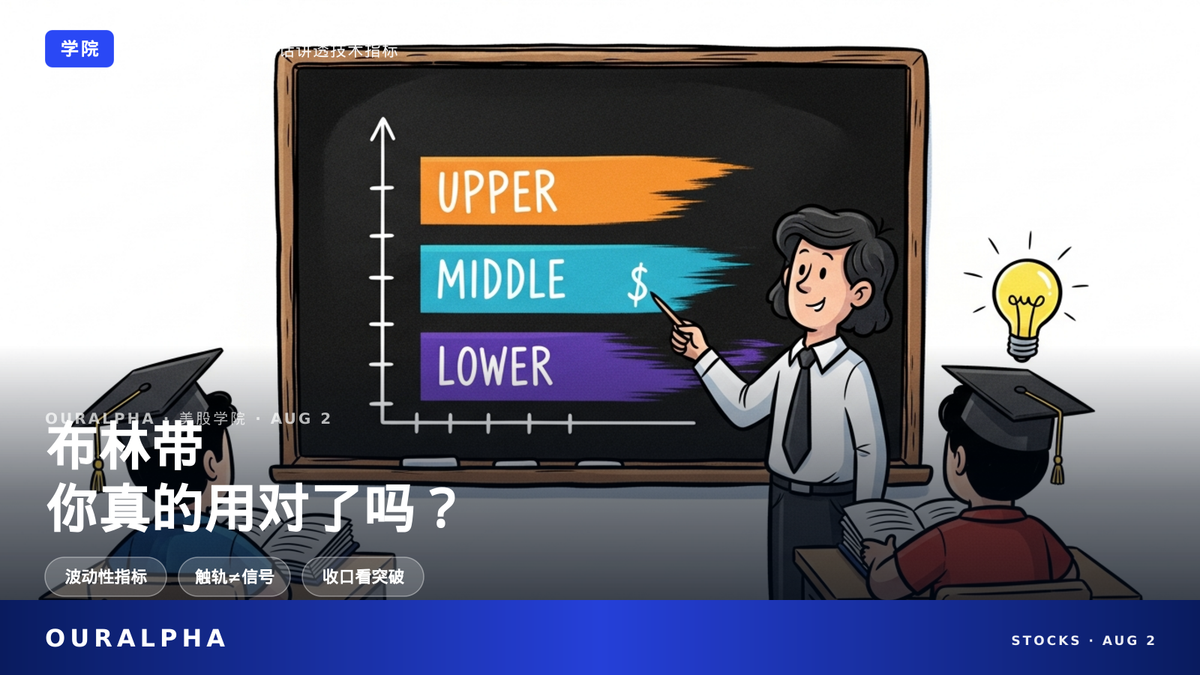
What Are Bollinger Bands?
Are You Really Using Them Right?

OurAlpha Academy · Technical Indicators in Plain English

Bollinger Bands are one of the most popular technical indicators, but many people sell when price touches the upper band and buy when it touches the lower band — and often get burned by the market.

In reality, Bollinger Bands measure volatility, not overbought or oversold conditions.

Understanding what they really do is the key to avoiding the most common beginner mistakes.

TL;DR · IN SHORT

  • Bollinger Bands measure volatility, not overbought or oversold conditions.
  • Touching a band is not a buy or sell signal; in trends, price can walk along the bands.
  • A squeeze hints at an upcoming volatility expansion, but it doesn't tell you the direction.

KEY TERMS

Bollinger Bands: A technical indicator made up of a middle band (a moving average) and upper and lower bands (the average plus/minus a number of standard deviations), used to gauge relative price levels and volatility.

Standard deviation: A statistical measure of how much price deviates from its average. The larger the standard deviation, the wider the Bollinger Bands and the more volatile the market.

%B: A measure of where the closing price sits within the Bollinger Bands. The middle band is 50%, the upper band is 100%, and the lower band is 0%. When price breaks out, %B can go above 100% or below 0%.

Bandwidth / Squeeze: The relative distance between the upper and lower bands. When it narrows to historically low levels, it's called a Squeeze, often signaling that a big move is coming.

CONTENTS

  1. What Are Bollinger Bands? What Do the Three Lines Represent?
  2. How Are Bollinger Bands Calculated? Is the Formula Complicated?
  3. When Price Touches the Upper or Lower Band, Should You Sell or Buy?
  4. What Does a Bollinger Band Squeeze Mean?
  5. What Is the %B Indicator? What Does It Mean When It Goes Above 100% or Below 0%?
  6. Are Bollinger Bands Better for Ranging or Trending Markets?
  7. What Are the Most Common Mistakes Beginners Make with Bollinger Bands?
  8. FAQ

What Are Bollinger Bands? What Do the Three Lines Represent?

Bollinger Bands are an indicator created by technical analyst John Bollinger in the 1980s. They consist of three lines: the upper band, the middle band, and the lower band[1]. The middle band is a moving average, by default a 20-day simple moving average; the upper and lower bands are the middle band plus or minus 2 standard deviations[2].

In simple terms, Bollinger Bands are like a 'dynamic channel' where price moves up and down most of the time. With default settings, about 88%-89% of price action falls within the bands[12].

Think of Bollinger Bands as the banks of a river: the middle band is the riverbed's centerline, and the upper and lower bands are the riverbanks. The water (price) usually flows along the channel, but sometimes it overflows the banks (breaks through the bands), which often signals a shift in market sentiment.

Unlike many 'overbought/oversold' indicators, Bollinger Bands don't directly tell you 'it's topped out' or 'it's bottomed out.' Instead, they tell you where price stands statistically relative to the recent past. This is key — as you'll see later, many beginners get into trouble because they mistake Bollinger Bands for an overbought/oversold indicator.

How Are Bollinger Bands Calculated? Is the Formula Complicated?

Actually, it's not complicated. There are three steps: first, calculate the N-period (default 20) simple moving average of closing prices to get the middle band; second, calculate the standard deviation of the same N-period closing prices; third, the upper band = middle band + 2 × standard deviation, and the lower band = middle band - 2 × standard deviation[3].

Standard deviation is a statistical concept that measures how much prices deviate from the average. The more volatile the market, the larger the standard deviation, and the wider the Bollinger Bands. When the market is calm, the standard deviation shrinks, and the bands narrow. So Bollinger Bands are essentially a volatility indicator[4].

For example, suppose a stock's average closing price over the past 20 days is 100 yuan, and the standard deviation is 2 yuan. Then the middle band is 100 yuan, the upper band is 104 yuan, and the lower band is 96 yuan. If one day the price jumps sharply, the standard deviation might become 3 yuan, making the upper band 106 yuan and the lower band 94 yuan — the bands widen.

The default settings are 20 periods and 2 standard deviations, but these are just defaults. John Bollinger himself emphasized that you can adjust the parameters for different markets or timeframes[2]. For instance, short-term traders might use 10 periods, while long-term investors might use 50.

When Price Touches the Upper or Lower Band, Should You Sell or Buy?

This is the most common misconception. The official rules clearly state that merely touching the lower band is not a buy signal, and touching the upper band is not a sell signal[8]. Bollinger Bands measure relative price levels, but 'relative high or low' doesn't mean 'overbought or oversold.'

Especially in strong trends, price will repeatedly hug and touch the same band — this is called 'walking the bands.' In that case, touching a band signals trend strength, not a reversal[9]. So if you trade against the trend just because price touches a band, you're likely to get run over.

Think of it this way: if a car is speeding down the highway, the wheels touching the lane line doesn't mean the car is about to turn around — it means the car is moving fast. Similarly, when price hugs the upper band, it shows strong bullish momentum, and shorting it would be like a mantis trying to stop a chariot.

So when does touching a band matter? It matters when combined with other indicators, like volume or momentum, or when waiting for confirmation from price patterns. Bollinger Bands provide a 'framework,' but real buy and sell signals need other tools to validate[8].

What Does a Bollinger Band Squeeze Mean?

When the distance between the upper and lower bands narrows to near the lowest level of the past period (often referenced as 6 months), it's called a 'Bollinger Band Squeeze'[6]. The quantitative measure of bandwidth is called BandWidth, calculated as (upper band - lower band) / middle band[5].

A squeeze means market volatility is extremely low. Historically, low-volatility periods are often followed by larger moves, but a squeeze itself doesn't predict the direction of the breakout[6]. In other words, it tells you 'a storm might be coming,' but not which way the wind will blow.

You can think of a Bollinger Band squeeze like a compressed spring: the tighter it's compressed, the higher it bounces when released. But which direction the spring bounces depends on external forces (like surprise news, capital flows, etc.).

The BandWidth indicator is useful because it lets you compare volatility levels across different assets and timeframes. For example, you can compare the BandWidth of different stocks to see which one is currently less volatile and might be poised for a bigger move.

What Is the %B Indicator? What Does It Mean When It Goes Above 100% or Below 0%?

%B measures where the closing price sits within the Bollinger Bands, calculated as (closing price - lower band) / (upper band - lower band). When price equals the middle band, %B is 50%; when it touches the lower band, %B is 0%; when it touches the upper band, %B is 100%[7].

When price breaks above the upper band, %B goes above 100%; when it breaks below the lower band, %B goes below 0%. This is often interpreted as a sign of trend continuation, not reversal[10]. %B can also be used to compare price with other indicators (like momentum or volume) to spot divergences[14].

For example, if a stock's price makes a new high, but a momentum indicator (like RSI) doesn't, that's a divergence signal. Using %B, you can more clearly see where price sits within the bands. If price is in the upper part of the bands (%B > 80%) while momentum weakens, it might suggest waning upside momentum.

Another benefit of %B is that it standardizes price, allowing you to compare different stocks. For instance, if one stock has a %B of 90% and another has 10%, you can see that the former is relatively strong and the latter relatively weak.

Are Bollinger Bands Better for Ranging or Trending Markets?

Bollinger Bands are better suited for ranging markets with some amplitude, because price tends to swing between the upper and lower bands. However, in a very low-volatility, flat market, touching a band can lead to repeated false breakouts and many false signals[13].

In trending markets, price can ride along a band for a long time without mean reversion, so using Bollinger Bands alone for timing is risky. It's better to combine them with other indicators, like volume or momentum, or with chart patterns (like double bottoms or double tops)[8][11].

For example, in a ranging market, you might buy when price touches the lower band and sell when it touches the upper band, but always set a stop-loss in case a trend suddenly starts. In a trending market, you might wait for price to pull back to the middle band before considering an entry, rather than blindly trading against the trend.

If you're interested in moving averages, check out our article on Moving Average Golden Cross and Death Cross; if you want to learn about RSI, we also have Common Misconceptions About RSI Overbought/Oversold.

What Are the Most Common Mistakes Beginners Make with Bollinger Bands?

The biggest mistake is treating Bollinger Bands as an 'overbought/oversold' indicator and trading in the opposite direction as soon as price touches a band. Especially in strong trends, price walks along the bands, and touching a band is actually a sign of trend continuation[9].

Another mistake is ignoring the lagging nature of Bollinger Bands. Since they're based on a moving average, they're a lagging indicator and can generate frequent false signals in ranging markets[13]. It's better to use them in conjunction with price patterns, volume, etc., rather than as a standalone buy/sell signal[8].

A common misconception is that a squeeze will always lead to a big up or down move. In reality, a squeeze only indicates low volatility; afterward, the market might continue to consolidate or break out suddenly, and the direction is uncertain. So don't blindly bet on direction just because of a squeeze.

If you want to learn about support and resistance, check out How to Draw Support and Resistance; to learn MACD, see MACD Golden Cross, Death Cross, and Divergence.

常见问题 FAQ

What are the default parameters for Bollinger Bands? Can I adjust them?

The default settings for Bollinger Bands are a 20-day simple moving average and 2 standard deviations for the upper and lower bands[2]. The creator, John Bollinger, himself emphasized that you can adjust these parameters for different markets and timeframes[2].

What's the difference between Bollinger Bands, moving averages, RSI, and MACD?

Bollinger Bands include a moving average but focus more on measuring volatility; RSI is a momentum indicator that measures whether price moves are overextended; MACD is a trend indicator that uses moving average relationships to gauge trend strength and reversals. They look at the market from different angles and are often used together in trading.

Does a Bollinger Band Squeeze mean the price will go up or down?

A Bollinger Band squeeze only indicates that current volatility is very low and a larger move may be coming, but it doesn't predict whether that move will be up or down[6]. To determine direction, you need to combine it with other information like the direction of the price breakout, volume, etc.

Are Bollinger Bands better for long-term or short-term trading?

Bollinger Bands can be used for both short-term trading and long-term investing, but you need to adjust the period parameter — short-term traders often use shorter moving average periods, while long-term investors use longer ones. Since Bollinger Bands are essentially a lagging indicator based on moving averages, using them alone in trending markets requires extra caution.

After price touches a band, what should I confirm before deciding to trade?

Bollinger Bands only indicate relative price levels, and the official rules emphasize that they shouldn't be used as a complete trading system on their own[8]. A safer approach is to first determine whether the market is trending or ranging, then use volume or momentum indicators (like RSI or MACD) to confirm the strength of buyers or sellers, rather than placing a trade immediately upon touching a band.

SOURCES

[1] Investopedia - Bollinger Bands
[2] Bollinger Band Rules - bollingerbands.com
[3] StockCharts ChartSchool - Bollinger Bands
[4] Fidelity - What Are Bollinger Bands?
[5] StockCharts ChartSchool - Bollinger Band Squeeze
[6] StockCharts ChartSchool - Bollinger Band Squeeze
[7] StockCharts ChartSchool - %B Indicator
[8] Bollinger Band Rules - bollingerbands.com
[9] Bollinger Band Rules - bollingerbands.com
[10] Bollinger Band Rules - bollingerbands.com
[11] StockCharts ChartSchool - Bollinger Bands
[12] StockCharts ChartSchool - Bollinger Bands
[13] Corporate Finance Institute - Bollinger Bands
[14] Bollinger Band Rules - bollingerbands.com

This content is for informational purposes only and does not constitute investment advice, trading advice, or any guarantee of returns.

Keep Reading

What's the Difference Between Call and Put Options? Calls vs. Puts Explained

What's the Difference Between Call and Put Options? Calls vs. Puts Explained
OURALPHA · ACADEMY

What's the Difference Between Call and Put Options?
A Simple Guide to Calls vs. Puts

OurAlpha Academy · Options basics in plain English

New to U.S. stock options? The first terms you'll hear are Call and Put, but what's the real difference?

Simply put, a Call is a "right to buy" you purchase when you expect prices to rise, and a Put is a "right to sell" you buy when you expect prices to fall.

But the rights and obligations of buyers and

Read full story →

Stay ahead of the market — never miss a deep dive

Follow OurAlpha for AI-driven US equity research and market insight, every day.