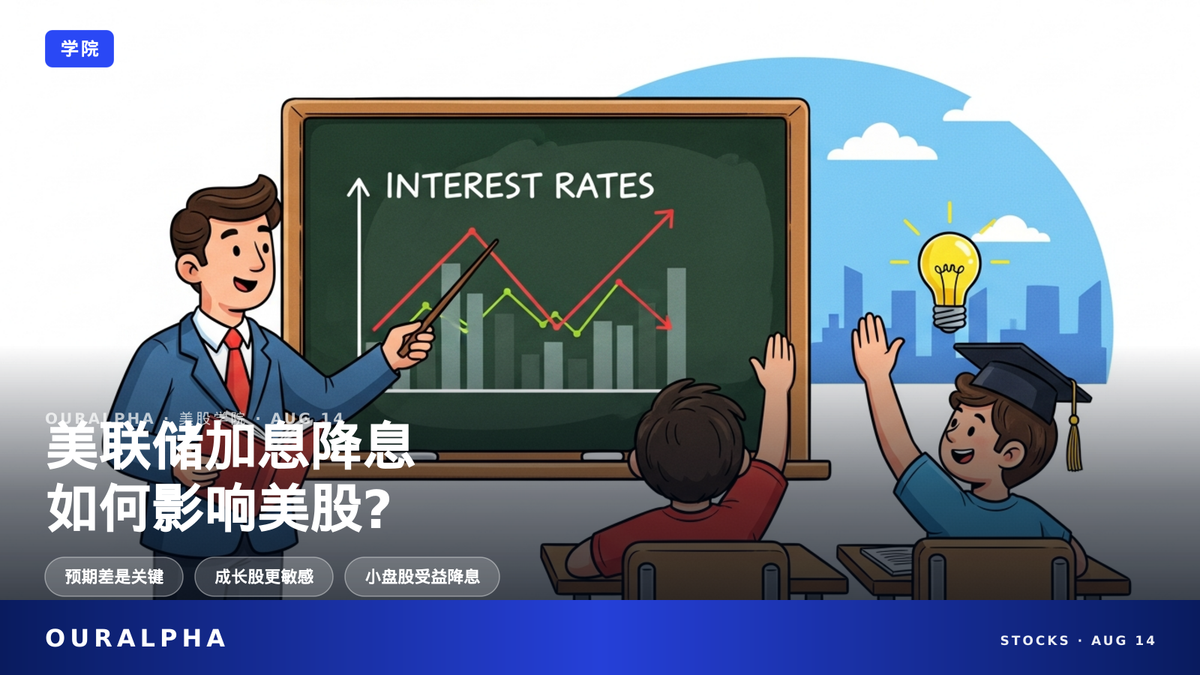
The Complete Guide to How Fed Rate Hikes and Cuts Affect US Stocks

How do Fed rate hikes and cuts affect US stocks? From rates to valuations, from growth stocks to small caps, understand the power of the expectation gap in one article.

The Complete Guide to How Fed Rate Hikes and Cuts Affect US Stocks
OURALPHA · ACADEMY

How Do Fed Rate Hikes and Cuts
Actually Affect US Stocks?

US Stock Academy · Understanding the Logic Between Rates and the Market

Every time the Fed meets, investors around the world hold their breath—but do you really know how rate changes reach your stock account?

From the federal funds rate to the dot plot, from growth stocks to small caps, we break down how rate hikes and cuts affect US stocks in plain English.

Remember: The market doesn't trade the rate itself—it trades the gap between expectations and reality.

TL;DR · IN SHORT

  • Rate hikes = borrowing gets more expensive, stock valuations take a hit, especially growth stocks
  • Rate cuts = borrowing gets cheaper, good for small caps and bond prices
  • What really moves stocks is 'does it match expectations,' not the action itself

KEY TERMS

Federal Funds Rate: The interest rate at which banks lend reserves to each other overnight, set as a target range by the Fed. It's the core tool of monetary policy.

FOMC: The Federal Open Market Committee, the Fed's monetary policy body that meets 8 times a year to set the direction of interest rates.

Dot Plot: An anonymous chart of Fed officials' individual rate forecasts, showing whether the policy path is 'hawkish' (higher rates) or 'dovish' (lower rates).

Discount Rate: The rate used to convert future cash flows into present value. The higher it is, the lower a stock's valuation.

Basis Point: The smallest unit for measuring interest rate changes. 1 basis point = 0.01%, and 100 basis points = 1 percentage point. When the news says 'hike by 25 basis points,' it means rates go up by 0.25 percentage points.

Expectation Gap: The difference between what the market actually sees and what investors had generally expected. Stock reactions to rate moves often depend more on this gap than on the move itself.

CONTENTS

  1. What Are Fed Rate Hikes and Cuts, Anyway?
  2. Why Do Rate Hikes Make Stocks Fall?
  3. Why Are Growth Stocks More Sensitive to Rate Hikes?
  4. Which Stocks Benefit Most from Rate Cuts?
  5. Why Do Stocks Sometimes Fall When the Fed Cuts Rates?
  6. What Is the Dot Plot, and Why Do Investors Watch It So Closely?
  7. How Long Do Rate-Hiking Cycles Usually Last, and What Lessons Does History Teach?
  8. FAQ

What Are Fed Rate Hikes and Cuts, Anyway?

Simply put, the Federal Reserve (the Fed) is America's 'central bank.' It sets the federal funds rate to adjust the cost of borrowing across the whole country. This rate is what banks charge each other for overnight loans of reserves, and the FOMC sets a target range for it[1]. Think of it as the 'price of money'—the higher the rate, the more expensive it is to borrow, and the better it is to save. For example, when the Fed sets a target range of 3.50%-3.75%, the cost of borrowing between banks floats within that range, and eventually it trickles down to the mortgage, car loan, and credit card rates we deal with.

The FOMC meets 8 times a year (roughly every 6-7 weeks) and announces its rate decision at 2:00 PM Eastern Time on the second day of each meeting[2]. For instance, at its meeting on July 29, 2026, the FOMC decided to hold the federal funds rate target range steady at 3.50%-3.75%[3]. The Fed's policy goals are a 'dual mandate': maximum sustainable employment and price stability, with a long-term inflation target of 2%[4]. In plain terms, the Fed wants both to help people who want jobs find them and to keep prices from rising too fast. These two goals sometimes clash—for example, raising rates to fight inflation can hurt employment—so the Fed has to balance the two.

Why Do Rate Hikes Make Stocks Fall?

A rate hike is like throwing cold water on the stock market. First, higher rates push up the discount rate—the rate used to convert future cash flows into present value. For every 2 percentage point increase in the discount rate (say, from 8% to 10%), the present value of a 20-year cash flow can shrink by nearly 24%[5]. That means future earnings get 'discounted' more heavily, so current valuations drop. Here's a simple way to think about it: Suppose you expect a company to earn $1 million in 20 years. At an 8% discount rate, that's worth about $215,000 today; at 10%, it's only about $149,000—a drop of nearly a third. So when rates rise, stocks that depend on future cash flows feel the pressure.

Second, rate hikes make bonds more attractive. Market rates and fixed-rate bond prices move in opposite directions: when rates rise, existing low-coupon bonds become less appealing, and their prices fall[6]. But new bonds offer higher yields, so money flows out of stocks and into bonds, pushing stock prices down further. For example, if new Treasury bonds yield 5% and stocks offer only a 6% expected return with much higher risk, many conservative investors will sell stocks and buy bonds, pulling money out of the equity market.

Why Are Growth Stocks More Sensitive to Rate Hikes?

Growth stocks (like tech) have most of their cash flows far in the future, and rate hikes raise the discount rate, which hits those distant cash flows harder. Research shows growth stocks are nearly twice as sensitive to interest rates as value stocks[7]. In simple terms, growth stocks are like 'promising a big pie'—a rate hike makes that pie less tempting. For instance, a startup tech company might expect to become highly profitable only in 10 years, while a bank earns steadily every year. When the discount rate rises, that big future payoff for the tech company shrinks a lot in today's terms, while the bank's annual earnings are less affected.

That's why, during a rate-hiking cycle, the Nasdaq (with its heavy tech weighting) often falls harder than the Dow (with its value tilt)—not because tech fundamentals suddenly worsen, but because their valuations are more sensitive to changes in the discount rate. Conversely, in a rate-cutting cycle, the same logic gives growth stocks more bounce, because a lower discount rate makes those distant cash flows 'worth more.'

Which Stocks Benefit Most from Rate Cuts?

Rate cuts mean cheaper borrowing, which is a direct boost for companies that rely on external financing. Small caps typically benefit more than large caps because smaller companies depend more on loans, and lower borrowing costs can significantly improve profits. Historical data shows that one year after a rate cut, small caps have outperformed large caps by an average of nearly 5 percentage points[10]. For example, a small company that was paying 8% interest might pay only 6% after a cut, and the savings go straight to the bottom line, lifting the stock. Large companies, with bigger cash reserves and less reliance on debt, benefit less.

Rate cuts also push bond yields down, making stocks with relatively high dividend yields (like utilities and consumer staples) more attractive. For instance, if Treasury yields fall from 4% to 2%, a utility stock yielding 3% starts to look very appealing, and money flows into these high-dividend names. But note: rate cuts don't always lift every stock—the key is whether the market has already priced it in.

Why Do Stocks Sometimes Fall When the Fed Cuts Rates?

That's the magic of the 'expectation gap.' The market doesn't trade the rate itself—it trades 'does it match expectations.' If investors expected a 50-basis-point cut and got only 25, stocks might fall instead of rise. Conversely, if the market has fully priced in a decision, the 'news is out' and volatility may be limited[12]. For example, if the market broadly expects a rate cut and has already bought stocks in advance, the actual announcement might trigger a 'sell the news' reaction.

Take the Fed's rate-cutting cycle that began in 2024: September saw a 50-basis-point cut, November and December each saw 25, for a total of 100 basis points that year[9]. But stocks didn't rise after every cut, because the market had already priced them in. For instance, before the September cut, expectations were already baked in, so the reaction was muted; and if a cut comes in smaller than expected, stocks can actually fall.

What Is the Dot Plot, and Why Do Investors Watch It So Closely?

The dot plot is a chart in the Summary of Economic Projections (SEP), released by the FOMC in March, June, September, and December. It uses anonymous dots to show each official's expectation for the federal funds rate over the next few years[11]. It's like the Fed's 'rate roadmap,' giving the market an early look at the likely path of future hikes or cuts. For example, if the dot plot shows rates heading higher, investors may adjust their strategies ahead of time, selling rate-sensitive stocks.

Changes in the dot plot can matter more than a single rate decision: if the dots shift higher (hawkish), stocks may fall; if they shift lower (dovish), stocks may rise. But remember, the dot plot is not a promise—it's just each official's personal forecast. An official might expect a hike next year, but if economic data changes, they can change their mind. So investors treat it as a guide, not a done deal.

How Long Do Rate-Hiking Cycles Usually Last, and What Lessons Does History Teach?

There's no fixed length for a hiking cycle; it depends on inflation and employment data. The most recent cycle ran from March 2022 to July 2023, with 11 consecutive hikes, including several 'jumbo' 75-basis-point moves[8]. That aggressive tightening sent the S&P 500 down nearly 27% at one point in 2022, closing the year down 18.1%—its worst year since 2008[8]. This example shows how severe the impact of rate hikes can be, especially when the market hasn't fully anticipated them. In 2022, many investors thought inflation was 'transitory' and didn't expect the Fed to be so aggressive, so stocks fell hard.

But history also shows that stocks eventually adapt to the new rate environment—after the 2022 crash, the market rebounded in 2023 and 2024. For long-term investors, rate-hiking cycles are a normal part of the landscape. Instead of getting anxious at every FOMC meeting, it's better to focus on whether your asset allocation can weather the volatility.

常见问题 FAQ

What is a 'basis point' (bp)? How much is a '25-basis-point hike'?

A basis point is the smallest unit for measuring interest rate changes. 1 basis point = 0.01%, and 100 basis points = 1 percentage point. So a '25-basis-point hike' means rates go up by 0.25 percentage points, and a '50-basis-point cut' means down by 0.5 percentage points. Understanding this conversion helps you grasp how aggressive a '75-basis-point super hike' really is.

When the Fed announces a hike or cut, should ordinary investors immediately rebalance?

It's not advisable to chase or flee based on a single meeting. Stock prices react to the expectation gap, not the rate move itself, and short-term direction is hard to predict. For long-term investors, the more important thing is to stay diversified and not get swayed by the emotional swings of one meeting, rather than trading in and out every FOMC.

Does the 'hikes fall, cuts rise' rule apply to every growth stock?

No. Growth stocks being more sensitive to rates is a statistical tendency, not an iron law that holds every time. Individual stock performance also depends on its own profitability, industry cycle, and market sentiment at the time. Rate changes are just one of many factors affecting valuations.

When is the Fed's next meeting, and how many times a year does it meet?

The FOMC holds 8 regular meetings a year, roughly every 6-7 weeks. Specific dates can be found on the Federal Reserve's website.

Are the dot plot rate forecasts accurate? Do Fed officials change their minds often?

The dot plot is just each official's personal judgment at a particular point in time, not a commitment to future rates. Once economic data like inflation or employment changes, officials adjust their expectations, so subsequent meetings often revise the path implied by earlier dot plots. Don't treat it as a fixed plan.

Should I put all my money into small caps during a rate-cutting cycle?

That's not the right takeaway. Small caps 'on average' benefit more from rate cuts is a historical pattern, not a guarantee that every small cap will outperform in every cutting cycle. Small caps are more volatile and less resilient to risk. Equating 'rate cuts are good for small caps' with 'you should go all-in on small caps' could actually amplify risk.

Besides stock prices, do rate hikes and cuts affect the cash in my account that isn't invested?

Yes. The federal funds rate is also a key reference for money market funds and bank deposit rates. In a hiking cycle, keeping idle cash in a money market fund usually earns higher interest; in a cutting cycle, that yield falls. That's why rate moves don't just affect stock prices—they also affect the return on the 'uninvested' part of your account.

SOURCES

[1] Federal Reserve — What is the Federal Open Market Committee?
[2] Federal Reserve — Federal Open Market Committee
[3] Federal Reserve issues FOMC statement (July 29, 2026)
[4] Federal Reserve — Monetary Policy: What Are Its Goals? How Does It Work?
[5] Understand the Discount Rate Used in a Business Valuation
[6] SEC Investor.gov — Investor Bulletin: Fixed Income Investments
[7] The Interest Rate Sensitivity of Value and Growth Stocks
[8] CNBC — Dow drops nearly 500 points to close at new low for 2022
[9] J.P. Morgan — December 2024 Fed Meeting: Fed Cuts Rates By 25 Basis Points
[10] Northwestern Mutual — Small Caps Outperform on Expected Rate Cuts
[11] Federal Reserve — Timeline: Summary of Economic Projections
[12] CNN Business — Fed holds interest rates steady after cliffhanger meeting

This content is for informational purposes only and does not constitute investment advice, trading advice, or any guarantee of returns.

Keep Reading

What Is a Bond ETF? A Practical Guide to Pairing It with Stocks

What Is a Bond ETF? A Practical Guide to Pairing It with Stocks
OURALPHA · ACADEMY

What Is a Bond ETF?
How to Pair It with Stocks for a Steadier Portfolio

US Stock Academy · Exchange-traded shares of a basket of bonds, helping you stay steady while seeking growth

Bond ETFs are often seen as 'safe assets,' but they have no maturity date and their prices fluctuate with interest rates.

If you want to use them with stocks to lower portfolio volatility, first understand how they behave.

This article explains in plain language the nature, risks, and pairing methods

Read full story →

Stay ahead of the market — never miss a deep dive

Follow OurAlpha for AI-driven US equity research and market insight, every day.