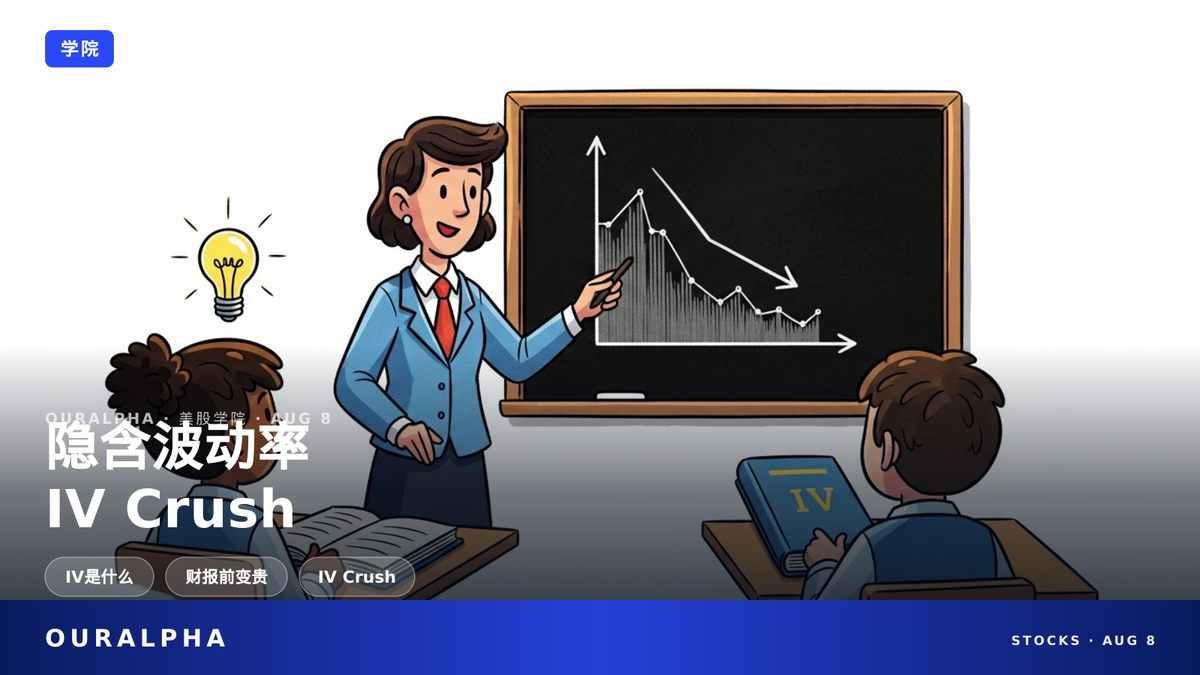
What Is Implied Volatility (IV)? Why Options Get Pricier Before Earnings

Options get pricier before earnings not because of a bullish outlook, but because implied volatility (IV) rises. This article explains IV, IV Crush, and Vega in plain English to help you avoid one of the sneakiest traps in options trading.

What Is Implied Volatility (IV)? Why Options Get Pricier Before Earnings
OURALPHA · ACADEMY

Why Do Options Get More Expensive Before Earnings?
A Plain-English Guide to Implied Volatility (IV)

OurAlpha Academy · Explaining the Core Variable of Options Pricing in Plain English

Many beginners think options get more expensive before earnings because 'everyone expects a big rally,' but what really drives prices up is implied volatility (IV)—the market's price tag on uncertainty itself.

Once earnings are released and uncertainty disappears, IV can collapse quickly (IV Crush). Even if you guess the direction right, option buyers can still lose money because of the IV crash.

This article will help you fully understand IV and avoid one of the sneakiest traps in options trading.

TL;DR · IN SHORT

  • Implied volatility (IV) is the market's expectation of future price swings, not a historical statistic.
  • Options get pricier before earnings because IV rises, not because the direction is bullish.
  • After earnings, IV Crush can make you lose money even if you guessed the direction right.
  • IV Rank and IV Percentile help you judge whether current IV is high or low.

KEY TERMS

Implied Volatility (IV): The volatility figure derived by plugging the current market price of an option into an options pricing model (usually Black-Scholes). It represents the market's expectation of how much the underlying asset's price will move in the future. It's a forward-looking indicator, not a historical statistic.

Vega: One of the option Greeks. It measures how much an option's price changes for every 1 percentage point change in implied volatility. At-the-money (ATM) options typically have the highest Vega.

IV Crush: The rapid decline in implied volatility after a scheduled event like earnings, as uncertainty disappears. This causes option premiums—especially the time value portion—to shrink significantly.

Historical Volatility (HV): A statistical measure based on the actual price movements of the underlying asset over a past period. It's a backward-looking indicator, as opposed to the forward-looking implied volatility.

IV Rank / IV Percentile: Two indicators used to gauge where current implied volatility stands relative to its historical range: IV Rank shows where current IV sits between the highest and lowest values over the past year (0-100); IV Percentile shows the percentage of trading days in the past year when IV was lower than the current level. Both are reference tools for judging whether IV is 'expensive' or 'cheap.'

VIX (Fear Index): An index compiled by the Chicago Board Options Exchange (Cboe) that measures the market's expectation of 30-day implied volatility for S&P 500 index options. It reflects overall market fear, not the IV of a single stock.

CONTENTS

  1. What Exactly Is Implied Volatility (IV)?
  2. Why Do Options Get More Expensive Before Earnings?
  3. What Is IV Crush? Why Can You Lose Money Even If You Guess the Direction Right?
  4. What Is Vega? How Does It Relate to Implied Volatility?
  5. What Are IV Rank and IV Percentile? How Do You Tell If Current IV Is High or Low?
  6. How Is the VIX Index Calculated? How Does It Relate to Individual Stock IV?
  7. Should You Buy or Sell Options Before Earnings to Avoid Getting Burned by IV Crush?
  8. FAQ

What Exactly Is Implied Volatility (IV)?

In simple terms, implied volatility (IV) is a number derived by plugging the current market price of an option into an options pricing model (like Black-Scholes) and solving for volatility[1]. It represents the market's expectation of how much the underlying asset (like a stock) will move in the future. Note: it's an 'expectation,' not 'what has already happened.'

For example: You buy a call option for $5. Where does that price come from? Besides the strike price, time to expiration, interest rates, and other factors, a key variable is volatility. If you hold all other variables constant, the volatility you solve for is the IV. The higher the IV, the more the market expects the stock to swing, and the more expensive the option.

Think of IV as 'the price the market puts on future uncertainty.' If the market broadly expects a stock to be calm in the future, its options will be cheap. Conversely, if everyone expects turbulence, options will be pricey. This 'pricey' or 'cheap' isn't just a feeling—it's a number derived from option prices, which is why it's called 'implied'—it's implied in the price.

So, IV is not a statistic calculated from historical prices; it's a forward-looking indicator 'reverse-engineered' from option prices[9]. It reflects market sentiment and expectations, not past performance. Historical volatility (HV), on the other hand, is calculated from the actual price movements of the stock over a past period. HV is the 'rearview mirror,' while IV is the 'windshield.' They are completely different.

Many beginners get confused: if a stock has been swinging wildly recently, they assume its options should be expensive. Not necessarily, because IV looks to the future, not the past. If the market believes the uncertainty has already been released (e.g., right after earnings), IV can be low even if past volatility was high.

Why Do Options Get More Expensive Before Earnings?

Earnings are a classic 'scheduled event'—before the announcement, nobody knows if the results will be good or bad, and the stock could swing sharply either way. This uncertainty pushes investors to bid up the implied volatility of the options, causing premiums to 'inflate'[7].

In other words, options get pricier before earnings not because the market thinks 'it will definitely rally,' but because the market thinks 'volatility will be high.' When IV rises, the time value of options increases, and premiums naturally get more expensive.

The SEC's investor bulletin also clearly states that option premiums are determined by factors including the relationship between the underlying price and the strike price, time to expiration, and the price volatility of the underlying asset[5]. Volatility (i.e., IV) is officially recognized as one of the three core pricing factors.

Here's a way to think about it: Earnings are like an exam. Before the exam, everyone is nervous, so they spend more on 'insurance' (options). The price of that insurance includes an 'uncertainty premium.' Once the exam is over and grades are out, regardless of good or bad, the uncertainty is gone, and the price of insurance naturally drops.

The OCC's official risk disclosure document also emphasizes that variables affecting option pricing include market participants' individual estimates of the underlying's future volatility, the underlying's historical volatility, remaining time to expiration, and that options on more volatile underlyings generally command higher premiums[6]. This shows that IV isn't just about a single option—it's a core variable in the entire options pricing system.

What Is IV Crush? Why Can You Lose Money Even If You Guess the Direction Right?

IV Crush refers to the rapid decline in implied volatility after a scheduled event like earnings, as uncertainty disappears, causing option premiums—especially the time value portion—to shrink significantly[7].

How severe can it be? Implied volatility typically peaks the day before earnings and can plummet 30%-40% or more on the first trading day after the announcement[8]. Even if your directional call is correct, the loss from IV crush can outweigh the gains from the correct direction, leaving you with a losing option position[8].

For example: You buy a call option with IV at 50% before earnings, paying a $5 premium. After earnings, the stock does rise, but IV instantly drops to 30%, and the premium might fall to $3. You got the direction right, but you lost money—that's the power of IV Crush.

Why does this happen? Because before earnings, IV is bid up, and the premium includes a large 'uncertainty premium.' After earnings, regardless of the outcome, the uncertainty vanishes, and that premium evaporates quickly. It's like popping a balloon—IV deflates instantly, and option prices drop with it.

Many beginners are puzzled the first time they experience IV Crush: 'I got the direction right, so why did I lose money?' That's because they only focused on direction and ignored the change in IV. So, when trading options around events like earnings, you must factor in the risk of IV Crush, or you might easily 'win the direction but lose the money.'

What Is Vega? How Does It Relate to Implied Volatility?

Vega is one of the option Greeks. It measures how much an option's price changes for every 1 percentage point change in implied volatility[4]. In simple terms, Vega tells you, 'For every 1% change in IV, how much is my option worth?'

At-the-money (ATM) options typically have the highest Vega, and it decreases as expiration approaches[4]. This explains why changes in IV have such a direct impact on option prices—especially before earnings, when IV is high and Vega is also high, making option prices highly sensitive to IV changes.

Think of Vega as a 'volume knob': IV is the volume, and Vega is the sensitivity of the knob. When Vega is high, a small move in IV causes a big swing in option price; when Vega is low, even if IV moves, the option price barely reacts.

Why do ATM options have the highest Vega? Because ATM options have zero intrinsic value, so their price is almost entirely determined by time value and IV, making them most sensitive to IV changes. Deep in-the-money or out-of-the-money options, on the other hand, are more influenced by intrinsic value or time decay, so their sensitivity to IV is relatively lower.

For a deeper dive into option Greeks, check out our earlier article: Vega, Delta, Gamma, and Theta in Options Greeks.

What Are IV Rank and IV Percentile? How Do You Tell If Current IV Is High or Low?

IV Rank measures where current IV sits between the highest and lowest values over the past year (0-100)[10]. For example, an IV Rank of 80 means current IV is higher than it was 80% of the time over the past year.

IV Percentile, on the other hand, is the percentage of trading days in the past year when IV was lower than the current level[10]. Both are used to judge whether current IV is 'expensive' or 'cheap,' helping you decide whether to be an option buyer or seller.

For instance, if IV Rank is very high, IV is at elevated levels, options are pricey, and selling options might be more favorable. Conversely, if IV Rank is low, IV is cheap, and buying options might be more advantageous. But note: this is just a reference tool, not a buy/sell recommendation.

Think of IV Rank as a 'thermometer': if current IV is 80 degrees (IV Rank=80), it's hot—options are expensive; if it's only 20 degrees (IV Rank=20), it's cool—options are cheap. IV Percentile is more like a 'historical ranking': if IV Percentile is 90, current IV is higher than 90% of trading days in the past year, which is an extreme situation.

These two indicators are similar but slightly different: IV Rank gives you a more intuitive sense of where current IV sits in the year, while IV Percentile tells you more precisely what proportion of historical trading days had lower IV. Using them together gives you a more complete picture of whether IV is high or low.

There's also the concept of Volatility Skew: for the same expiration, implied volatility differs across strike prices. Stock options markets typically exhibit a downward skew—out-of-the-money put options have higher implied volatility than call options[11]. This shows that IV isn't a single number but a whole 'surface.' Beginners often overlook this, assuming all strikes have the same IV, but that's not the case.

How Is the VIX Index Calculated? How Does It Relate to Individual Stock IV?

VIX is the 'fear index' compiled by the Chicago Board Options Exchange (Cboe). It measures the market's expectation of 30-day volatility (using S&P 500 index options with 23-37 days to expiration) in real time[2]. It's calculated by taking a weighted average of the mid-quotes of a basket of S&P 500 index call and put options[2].

VIX reflects the implied volatility of the entire market, while individual stock IV reflects the implied volatility of a single stock. They are related but different. When the market panics, VIX spikes, and individual stock IV usually rises too, but the magnitude may vary.

VIX is the official 'fear index' of the derivatives market, and it reflects implied volatility, not historical volatility[3].

Think of VIX as a 'market sentiment thermometer': when VIX is low, market sentiment is calm, and everyone expects smooth sailing; when VIX spikes, the market is panicking, and investors rush to buy protective options, pushing up IV.

The relationship between VIX and individual stock IV is like the relationship between 'the market and the stock': if the market rises, individual stocks don't necessarily rise; if the market panics, individual stock IV usually rises, but how much depends on the stock's own events (like earnings). So, when trading individual stock options, you should watch both VIX and the stock's own IV.

FINRA classifies options as higher-complexity investment products and explicitly notes that option values are affected by both time value and volatility expectations, requiring investors to understand these pricing factors and associated risks before trading[12]. This shows that understanding IV and VIX isn't just an advanced skill—it's fundamental knowledge that regulators expect investors to master.

Should You Buy or Sell Options Before Earnings to Avoid Getting Burned by IV Crush?

There's no one-size-fits-all answer, but understanding the mechanics of IV Crush is key. If you're an option buyer, IV is high before earnings, and the premium you pay includes a large 'uncertainty premium.' After earnings, IV crushes, and you might lose on the time value[8].

If you're an option seller, selling options before earnings lets you collect a higher premium, but the risk is also high—if the stock moves sharply, you could face huge losses. Option sellers have unlimited risk, while buyers have limited risk (max loss is the premium), but buyers have a lower win rate.

For a clearer look at the risk differences between buyers and sellers, check out: Who Bears More Risk: Option Buyers or Sellers? A Clear Look at Odds and Risks.

If you're a buyer, you might consider buying a straddle (buying both a call and a put at the same strike price, betting on a big move rather than a specific direction) or a strangle (a variant of the straddle with different strike prices, lower cost but requiring a larger move to profit) before earnings, but be mindful of IV Crush risk. If you're a seller, you might consider selling an Iron Condor (a combination of selling an out-of-the-money call spread and an out-of-the-money put spread, betting that the stock won't move much), but be aware of tail risk. Whatever strategy you choose, plan ahead for the impact of IV changes.

Some traders actually use IV Crush to their advantage: they sell options before earnings to collect the high premium from elevated IV, then buy them back after earnings when IV has crushed, pocketing the difference. But this requires precise judgment and risk management, and it's not suitable for beginners.

Finally, remember a key point: options trading isn't just about direction—it's about trading 'volatility.' Understanding IV and its changes is a core skill in options trading.

常见问题 FAQ

What's the difference between implied volatility (IV) and historical volatility (HV)?

Historical volatility is calculated from the standard deviation of past price movements and is a backward-looking indicator. Implied volatility is derived from current option market prices and reflects the market's expectation for the future, making it a forward-looking indicator[9].

Is IV Crush good or bad for option sellers?

It's usually good for sellers: sellers collect a higher premium when IV is elevated before earnings, and after earnings, when IV crushes and premiums shrink, sellers can buy back the options at a lower price to lock in profits. The trade-off is that if the stock moves sharply, sellers face losses that can be much larger than what buyers risk[8].

Is Vega positive or negative?

Vega is typically positive, meaning that as IV rises, option prices rise, and as IV falls, option prices fall. However, the exact value varies depending on the option type and strike price[4].

Does an individual stock's IV always move with the VIX?

Not necessarily. VIX reflects the overall market's implied volatility, while an individual stock's IV is also influenced by its own events (like earnings). Even if VIX is low and the market is calm, a stock approaching earnings can have noticeably higher IV due to the uncertainty of the earnings report[2].

Is buying options before earnings always a losing proposition?

Not always, but the risk is high. Because IV Crush can shrink the premium, you might lose money even if your direction is correct[8].

Which is better: IV Rank or IV Percentile?

Both have their pros and cons. IV Rank is more intuitive, while IV Percentile is more precise, but both are just reference tools and should not be used as the sole basis for trading decisions[10].

SOURCES

[1] The Black-Scholes Model (Columbia University)
[2] Cboe Volatility Index Methodology
[3] VIX Volatility Products | Cboe
[4] Options Vega - The Greeks (CME Group)
[5] Investor Bulletin: An Introduction to Options | SEC
[6] Characteristics and Risks of Standardized Options (OCC)
[7] The Crush Is Real (OIC)
[8] The Mechanics of Implied Volatility Crush (Schaeffer's)
[9] Implied Volatility vs Historical Volatility Compared | SoFi
[10] Implied Volatility IV Rank and IV Percentile | Barchart

This content is for informational purposes only and does not constitute investment advice, trading advice, or any guarantee of returns.

Keep Reading

What Is a Bond ETF? A Practical Guide to Pairing It with Stocks

What Is a Bond ETF? A Practical Guide to Pairing It with Stocks
OURALPHA · ACADEMY

What Is a Bond ETF?
How to Pair It with Stocks for a Steadier Portfolio

US Stock Academy · Exchange-traded shares of a basket of bonds, helping you stay steady while seeking growth

Bond ETFs are often seen as 'safe assets,' but they have no maturity date and their prices fluctuate with interest rates.

If you want to use them with stocks to lower portfolio volatility, first understand how they behave.

This article explains in plain language the nature, risks, and pairing methods

Read full story →

Stay ahead of the market — never miss a deep dive

Follow OurAlpha for AI-driven US equity research and market insight, every day.