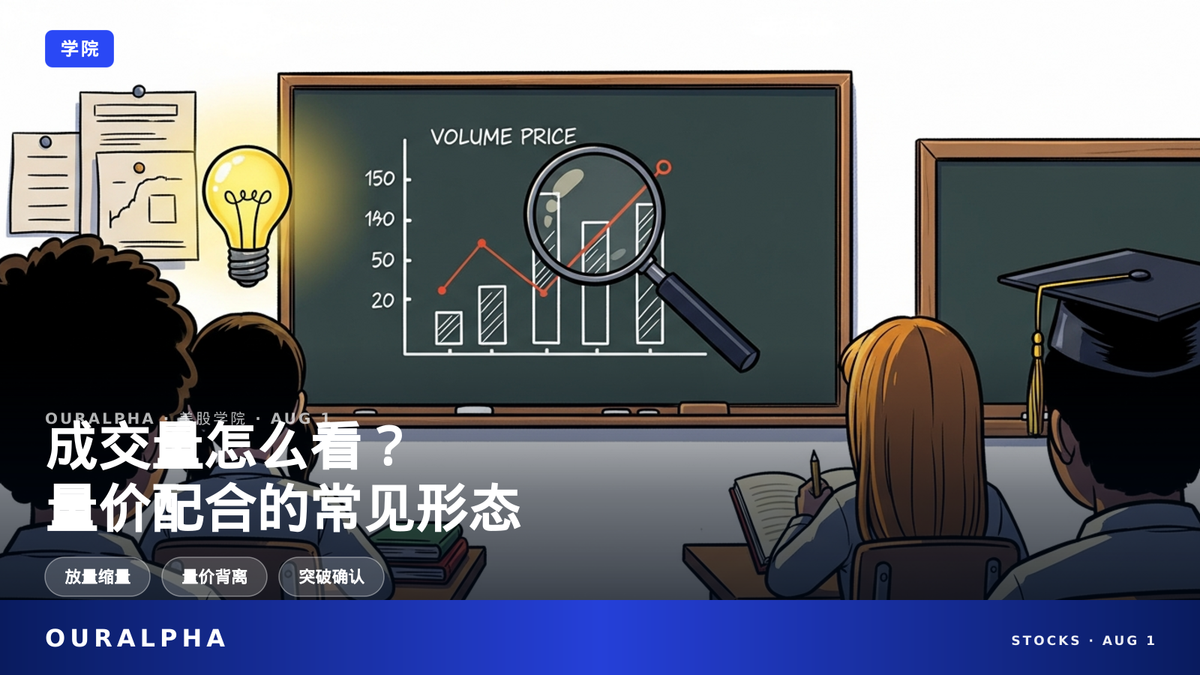
How to Read US Stock Trading Volume? A Detailed Guide to Volume-Price Patterns

Volume isn't about bigger being better; the key is its relative level and whether it moves in sync with price. This article explains common volume-price patterns in plain English to help you verify trends.

How to Read US Stock Trading Volume? A Detailed Guide to Volume-Price Patterns
OURALPHA · ACADEMY

How to Read Trading Volume?
A Complete Guide to Common Volume-Price Patterns

OurAlpha Academy · Understand Volume and Price, Avoid Detours

Many people think that higher volume is always better, but the same bullish candle with high volume can mean very different things depending on where it appears.

The key to understanding volume-price relationships is not the absolute number, but whether volume is expanding or contracting relative to recent averages, and whether it moves in sync with price.

Once you understand volume-price alignment, you can verify the strength of a trend. This article explains how to read volume in plain, simple English.

TL;DR · IN SHORT

  • Volume reflects market participation, but the key is whether it's expanding or contracting relative to recent averages, not that bigger is always better.
  • Volume-price alignment (moving in the same direction) suggests a trend is reliable, while divergence (moving in opposite directions) warrants caution for a reversal.
  • Breakouts or breakdowns on high volume are more reliable; low-volume breakouts are often false, and don't chase a rally without volume.

KEY TERMS

Volume: The number of shares of a security that are actually traded during a given period, and a core indicator of market activity and liquidity.

Volume-Price Relationship: The alignment or divergence between changes in volume and changes in price, used to verify the true strength of a price trend.

OBV (On-Balance Volume): A volume indicator that adds or subtracts each day's volume based on whether the close is up or down, used to confirm trends or spot divergences.

VWAP (Volume-Weighted Average Price): The average price of a security weighted by volume throughout the day, often used by institutions as a benchmark for large orders and by day traders as a dynamic support/resistance reference.

RVOL (Relative Volume): Current volume divided by the average volume over a past period (usually 10-20 trading days). A ratio above 1 indicates above-average volume, below 1 indicates below-average, used to gauge whether current volume is unusual.

ADTV (Average Daily Trading Volume): The average volume over a period (usually 20 or 30 trading days), used as a benchmark for what is 'normal' trading activity for a stock.

CONTENTS

  1. What Exactly Is Volume, and Why Does It Matter?
  2. How Do You Read Volume-Price Alignment? What Does It Mean in Uptrends and Downtrends?
  3. Why Should You Be Cautious About a 'Rally Without Volume'?
  4. Why Should You Watch Volume When Price Breaks Resistance or Support?
  5. What Is Volume-Price Divergence? Why Does It Often Signal a Reversal?
  6. What Are OBV and VWAP? Which Should Regular Investors Watch?
  7. What Does 'Blow-Off Top on Huge Volume, Rock-Bottom on Tiny Volume' Mean? How to Use Relative Volume?
  8. FAQ

What Exactly Is Volume, and Why Does It Matter?

Simply put, volume is the number of shares of a security that are actually traded during a given period (usually counted per trading day)[1]. It's like the market's thermometer, directly reflecting the participation enthusiasm of buyers and sellers. The higher the volume, the more active the trading and the better the liquidity, making it easier to buy or sell at prices close to the market, with lower impact costs (the extra cost you pay because the order book isn't deep enough, forcing you to pay up or sell down)[3].

Imagine you want to buy a limited-edition sneaker. If only one person is selling, you might have to pay a high price; but if many people are selling, you can shop around and get a better deal. The stock market works the same way. Higher volume means many buyers and sellers, so when you want to buy, someone is selling, and when you want to sell, someone is buying. Trading is smooth, and costs are low.

In the US stock market, volume data is generated by the Consolidated Tape, which aggregates trade reports from all national securities exchanges, alternative trading systems (ATSs), and over-the-counter market makers. Since December 2013, odd lot trades (fewer than 100 shares) have been printed to the Consolidated Tape, but according to the SEC's official definition of Consolidated Volume, odd lot trades are typically not included in the official volume statistics. Today, odd lot trades account for more than half of all trades; according to SEC data, in February 2025 they made up about 64.4% of all US stock trades[2]. So, the volume you see is a fairly comprehensive market data point.

Here's a small detail: In the early years (before the end of 2013), odd lot trades were indeed not included in the Consolidated Tape statistics, because they were a small fraction of trades and had limited impact on the overall market. But as odd lot trading has grown to more than half of all trades, regulators have required odd lot trades to be printed to the Consolidated Tape to improve transparency—however, note that this 'printing' only makes odd lot trades visible; according to the SEC's official definition of Consolidated Volume, odd lot trades are still typically not included in the official volume statistics.

How Do You Read Volume-Price Alignment? What Does It Mean in Uptrends and Downtrends?

The core of volume-price alignment is whether volume and price direction move in sync. For example, if an uptrend is accompanied by expanding volume (or above-average volume), it indicates strong buying interest, making the trend more reliable and potentially pushing prices higher[4]. Conversely, if a downtrend is accompanied by expanding volume, it indicates strong selling pressure and shaken investor confidence, potentially driving prices lower[5].

For instance, a stock rising on high volume is like a crowd rushing to buy tickets—full of momentum. A stock falling on high volume is like everyone scrambling to leave—panic spreading. So, when volume and price align, the trend has more 'substance.'

You can think of volume as the fuel that powers the ship of price. With plenty of fuel (high volume), the ship moves fast and steady; with little fuel (low volume), it moves slowly or even reverses. So, when prices rise and volume expands, there's a steady stream of buying power driving the move. Conversely, when prices fall and volume expands, selling pressure is intense, and the downtrend may continue.

Why Should You Be Cautious About a 'Rally Without Volume'?

If a stock price rises but volume doesn't expand or even keeps shrinking, it means market participation is limited. Even if the price can still rise in the short term, the trend lacks 'fuel' and is likely to run out of steam and pull back later[6]. It's like a car running on fumes—it can coast for a while but won't go far. So when you see a rally without volume, don't rush to chase it; think about whether it's just 'false fire.'

For example, suppose a stock rises for several days, but each day's volume gets lower and lower. It's like a movie with good reviews, but fewer and fewer people are in the theater. Such a rally might be driven by a few players, lacking broad market consensus. Once buying dries up, the price can easily turn down.

Why Should You Watch Volume When Price Breaks Resistance or Support?

When a stock price breaks above a resistance level, if accompanied by noticeably higher volume (above average), the breakout is generally considered more valid. Conversely, a low-volume breakout often indicates weak market enthusiasm and is likely a 'false breakout.' Similarly, a breakdown below support on high volume is more trustworthy[7].

It's like pushing a door: if someone is pushing from the other side (high volume), the door opens easily; if no one is pushing (low volume), the door might just be swinging on its own. So, on breakouts or breakdowns, volume is key to verifying whether the signal is real. To learn more about support and resistance, check out this article: What Are Support and Resistance Levels?

Specifically, when a stock breaks above an important resistance level, if volume expands significantly, it means a lot of money is willing to buy at that price. The breakout is built on 'real money,' so the probability of further gains is higher. Conversely, if volume is small during the breakout, it might just be a few traders' actions, and the market as a whole doesn't endorse it. The price is likely to fall back, forming a 'false breakout.' Similarly, when breaking below support, if volume expands, selling pressure is heavy, and the downtrend may continue; if it breaks on low volume, it might be a 'false breakdown,' and the price could quickly recover.

What Is Volume-Price Divergence? Why Does It Often Signal a Reversal?

Volume-price divergence is when price and volume move in opposite directions. For example, when price makes a new high but volume fails to expand or even shrinks, it often signals that the trend's reliability is declining and a reversal may be brewing[8]. It's like climbing a mountain: the higher you go, the fewer people follow, and eventually you can't climb any further. So, when price makes new highs or lows but volume doesn't cooperate, be alert that the trend might 'change its face.'

The essence of volume-price divergence is the exhaustion of market momentum. When price makes a new high, buyers are still trying to push higher, but shrinking volume means fewer and fewer buyers are willing to follow. It's like a team climbing halfway up the mountain, with fewer and fewer followers—the momentum is clearly fading. Conversely, when price makes a new low and volume shrinks, selling pressure is also weakening, and the decline may be nearing its end. So, volume-price divergence is an important warning sign of a potential reversal.

What Are OBV and VWAP? Which Should Regular Investors Watch?

OBV (On-Balance Volume) is an indicator introduced by Joseph Granville in 1963. It adds volume on up days and subtracts on down days, cumulatively forming a line that helps confirm trends or spot divergences[9]. VWAP (Volume-Weighted Average Price) is the cumulative (price × volume) divided by cumulative volume for the day, reflecting the volume-weighted 'average cost line.' Institutions often use it as a benchmark for large orders, and day traders use it as a dynamic support/resistance level[10].

Regular investors don't need to stress over which to watch. You can use OBV as a trend-confirmation tool and VWAP as an intraday reference line. Combining both helps you understand volume-price relationships more comprehensively. If you want to build a foundation first, I recommend checking out How to Read Candlestick Charts and Moving Average Golden Cross and Death Cross.

OBV is simple to calculate: if today's close is higher than yesterday's, add today's volume to the cumulative value; if lower, subtract; if unchanged, keep it the same. This way, the OBV line reflects the cumulative flow of money in and out. When OBV makes a new high but price doesn't, it forms a 'bearish divergence,' potentially signaling a decline. Conversely, when OBV makes a new low but price doesn't, it forms a 'bullish divergence,' potentially signaling a rise.

VWAP is more intuitive; it's roughly the average cost of all traders for the day. If the price is above VWAP, it means the current price is above the average cost, and bulls have the upper hand. If below, bears have the upper hand. Day traders often use VWAP as a reference line for buying or selling. For example, if the price pulls back to VWAP and doesn't break below, it might be a buying opportunity.

What Does 'Blow-Off Top on Huge Volume, Rock-Bottom on Tiny Volume' Mean? How to Use Relative Volume?

'Blow-off top on huge volume' refers to extreme volume (exhaustion volume) often appearing at the end of a strong trend: after a final surge or plunge on massive volume, the trend stalls or reverses, and volume quickly shrinks[13]. It's like a firework's last blast—the loudest, and then it's gone.

To determine whether current volume is expanding or contracting, you can use Relative Volume (RVOL), which equals current volume divided by the average volume over the past 10-20 days. A ratio above 1 indicates above-average volume, below 1 indicates below-average[11]. Additionally, Average Daily Trading Volume (ADTV) typically uses a 20- or 30-day average as the 'normal' benchmark[12].

For example, if a stock's average daily volume over the past 20 days is 1 million shares, and today it trades 2 million shares, then RVOL is 2, indicating a clear volume expansion. If today it trades only 500,000 shares, RVOL is 0.5, indicating a contraction. Using RVOL, you can quickly gauge whether current market participation is unusual.

The logic behind 'blow-off top on huge volume' is: when a trend reaches its final stage, market sentiment is extremely euphoric or panicked, and a flood of money rushes in or out, causing volume to spike. But extremes reverse. When everyone who wanted to buy has bought, and everyone who wanted to sell has sold, there's no new force to push the price, so the trend reverses. So, when you see a stock that has been rising continuously suddenly release huge volume, be wary of a top; after a continuous decline, huge volume might signal a bottom.

常见问题 FAQ

What does a sudden surge in volume mean?

A sudden surge in volume means market participation has spiked, which could be a sign of major news, unusual money flow, or a trend turning point. But the specific meaning depends on the price direction: a surge on an up day might suggest continued gains, a surge on a down day might suggest continued losses, or it could appear at the end of a trend (blow-off top) signaling a reversal.

What does a 'bearish divergence' in OBV mean?

A bearish divergence in OBV occurs when the stock price makes a new high, but OBV (On-Balance Volume) does not make a new high, indicating that the momentum behind the rally is actually weakening[9]. This divergence is often seen as a warning sign that the trend may be topping out, opposite to a 'bullish divergence' (price makes a new low but OBV doesn't, indicating weakening selling pressure).

How much volume counts as 'high volume'? Is there a specific number?

There's no one-size-fits-all number. Volume is relative and should be compared to the stock's own recent trading levels. A common method is to use Relative Volume (RVOL)—current volume divided by the average volume over the past 10-20 days. A ratio above 1 means above-average volume, below 1 means below-average[11]. You can also use Average Daily Trading Volume (ADTV, typically a 20- or 30-day average) as a benchmark[12].

Do I always need to check volume when price breaks resistance or support?

Not necessarily, but checking volume can improve your accuracy. Breakouts on high volume are more reliable; low-volume breakouts are often false. Breakdowns on high volume are more trustworthy; low-volume breakdowns might be quickly reversed. It's best to combine price patterns and volume for a comprehensive judgment.

What does it mean when the price is above or below VWAP?

VWAP is roughly the average cost of all traders for the day. When the price is above VWAP, most intraday participants are in profit, which is generally seen as bullish. When the price falls below VWAP, the average cost line is lost, and bears have the upper hand[10]. Day traders often use a pullback to VWAP that doesn't break below as a short-term buy reference.

Can I chase a stock that is rising without volume?

Rallies without volume are generally not recommended to chase, because without volume support, the rally may not be sustainable. But you should also consider the specific stock, such as a small float or tightly held shares, which can rise without volume.

If I see a stock release 'huge volume,' should I sell immediately?

It's not that simple. 'Blow-off top on huge volume' reminds us that extreme volume often appears at the end of a strong trend, and it's a signal to be cautious[13], but it doesn't mean the price will reverse immediately. It could also be a mid-trend climax. A safer approach is to treat huge volume as a warning signal and combine it with other clues like price patterns and volume-price divergence before acting, rather than reacting immediately to high volume.

SOURCES

[1] Trading volume Definition | Nasdaq
[2] Consolidated Tape | Investor.gov
[3] Volume - Overview, Liquidity, and Exhaustion Moves | CFI
[4] 3 Ways Volume Can Help Confirm Price Trends | Charles Schwab
[5] 3 Ways Volume Can Help Confirm Price Trends | Charles Schwab
[6] Trading Volume as a Market Indicator | Charles Schwab
[7] Trading Volume as a Market Indicator | Charles Schwab
[8] 3 Ways Volume Can Help Confirm Price Trends | Charles Schwab
[9] On Balance Volume (OBV) | ChartSchool | StockCharts.com
[10] How to Use Volume-Weighted Indicators in Trading | Charles Schwab
[11] Relative Volume (RVOL) | ChartSchool | StockCharts.com
[12] Average Daily Trading Volume (ADTV) | CFI
[13] Volume - Overview, Liquidity, and Exhaustion Moves | CFI

This content is for informational purposes only and does not constitute investment advice, trading advice, or any guarantee of returns.

Keep Reading

What's the Difference Between Call and Put Options? Calls vs. Puts Explained

What's the Difference Between Call and Put Options? Calls vs. Puts Explained
OURALPHA · ACADEMY

What's the Difference Between Call and Put Options?
A Simple Guide to Calls vs. Puts

OurAlpha Academy · Options basics in plain English

New to U.S. stock options? The first terms you'll hear are Call and Put, but what's the real difference?

Simply put, a Call is a "right to buy" you purchase when you expect prices to rise, and a Put is a "right to sell" you buy when you expect prices to fall.

But the rights and obligations of buyers and

Read full story →

Stay ahead of the market — never miss a deep dive

Follow OurAlpha for AI-driven US equity research and market insight, every day.