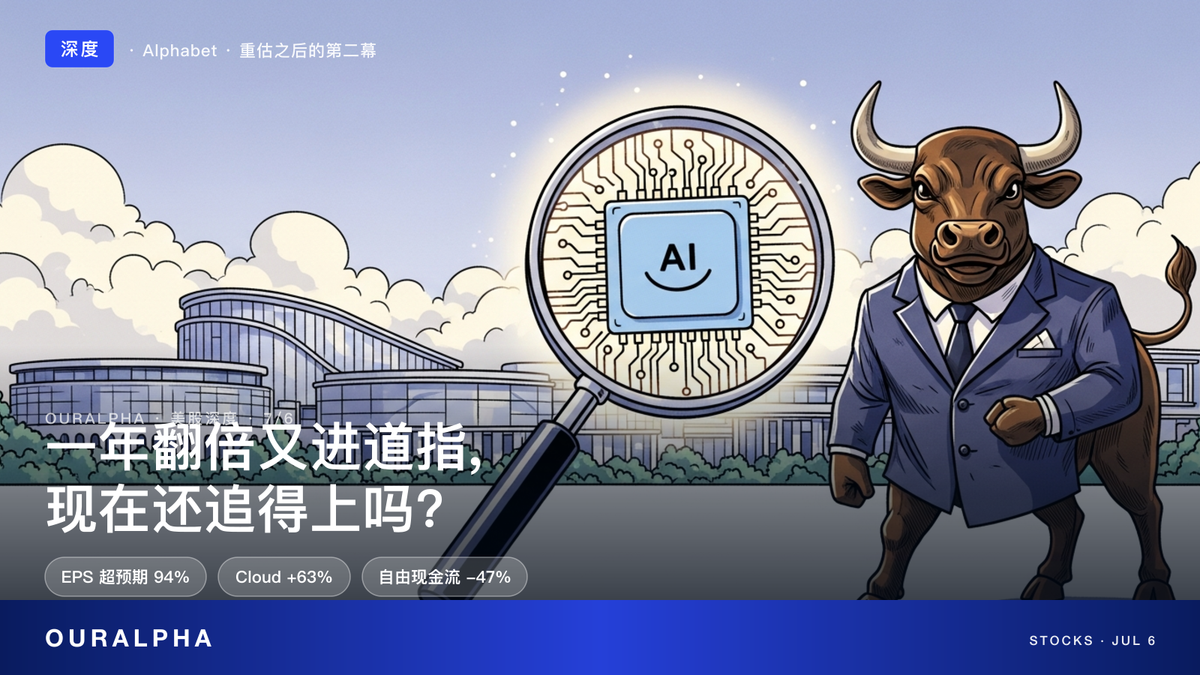
After Doubling and Joining the Dow: The Alphabet You're Buying Today Is Not the Same Company

Alphabet's stock has more than doubled and landed in the Dow — but free cash flow was cut in half and the valuation sits just 3.5% below the dot-com bubble peak. So what exactly are you buying now?

Alphabet GOOGL stock chart showing 100% one-year gain alongside Dow Jones Industrial Average inclusion
Alphabet replaced Verizon in the Dow on June 29 — a symbolic crowning of the AI era, but with free cash flow halved and valuation near historic peaks, Act Two still has to be earned.
OURALPHA · U.S. EQUITIES IN DEPTH · ALPHABET
After Doubling and Joining the Dow:
The Alphabet You're Buying Today Is Not the One from a Year Ago
A year ago, the market was still debating whether ChatGPT would kill Google Search. A year later, Alphabet has more than doubled, earned a spot in the Dow Jones, and posted Q1 EPS that beat estimates by 94%. But the flip side of that doubling is free cash flow cut nearly in half — and a market trading just 3.5% below the dot-com bubble peak. So what exactly are you buying now?

Let's start with the hard facts. As of the July 2 close (last Thursday, after which U.S. markets were shut for the Independence Day holiday and weekend), Alphabet (GOOGL) was at $359.91, up roughly 14.2% year-to-date and more than 100% over the past twelve months. On June 29, it officially replaced Verizon in the Dow Jones Industrial Average.

Taken at face value, it's a straightforward winner's story. But what interests us more is the structure: what happened to Alphabet over the past year was not simply "the business got better" — it was a complete re-categorization. The market reclassified it from "a search-ad company that might get disrupted by AI" to "a full-stack AI infrastructure company." Change the category, and you change the valuation anchor. The doubling was just the price tag on that anchor shift.

The problem: re-categorization is a one-time event. With the re-rating already priced in, investors buying today aren't getting the "correction trade" — they're buying Act Two: whether that $460 billion backlog and $190 billion in capex can actually convert into profit. In this piece, we run those two sets of books separately.

In This Article
01 · Joining the Dow: A Long-Overdue Stamp of Legitimacy
02 · Revenue Breakdown: Search Still Dominates, Cloud Is the Growth Engine
03 · The Price Tag: $190B in Capex and Free Cash Flow Cut Nearly in Half
04 · Valuation: An Alphabet Problem — or a Whole-Market Problem?
05 · Conclusion: Buying After the Double Means Running Two Separate Sets of Books
01 Joining the Dow: A Long-Overdue Stamp of Legitimacy

On June 23, S&P Global announced that Alphabet would replace Verizon in the Dow Jones Industrial Average, effective June 29. The departing Verizon had been a Dow component since 1984 — a company that defined the landline and mobile era, yielding its seat to one that defines the search and AI era. The symbolism is self-evident. S&P Global's official rationale: Alphabet's market cap, share price, and business breadth make it a "more representative communications services component" for the index.

Trade publication MediaPost put it more bluntly: the change validates how "advertising and artificial intelligence are seen as cornerstones of commerce." In other words, the index committee cast a vote with its constituent change — AI is no longer a narrative but foundational infrastructure for the U.S. economy.

There is a technical detail most people overlook: the Dow is a price-weighted index — the higher the share price, the bigger the weighting, regardless of market cap. Per The Wall Street Journal's calculations, Alphabet's weight in the Dow is roughly 4% — less than Goldman Sachs and Caterpillar, each of which exceeds 10%. If the Dow were cap-weighted like the S&P 500, Alphabet would rank in the top three. So the passive-flow impact of the inclusion is actually limited; the significance is largely ceremonial — the "re-categorization" we described above, now rubber-stamped by the index committee.

02 Revenue Breakdown: Search Still Dominates, Cloud Is the Growth Engine

Ceremony needs substance, and Alphabet's Q1 2026 results are the bedrock of this entire rally. Per data compiled by 24/7 Wall St., the quarter produced EPS of $5.11 against a consensus estimate of just $2.63 — a beat of 94.1%. On the surface, that looks like a collective failure of analyst models — but hold that conclusion; we'll unpack the quality of that number below. Operating income grew 29.7% year-over-year and operating margin expanded to 36.1%.

Chart 1 · Q1 2026 EPS: Consensus Estimate vs. Actual (USD)
Consensus Estimate
$2.63
Reported
$5.11 (beat by 94.1%)
Source: 24/7 Wall St. · OurAlpha

But quality matters more than the headline. Here's one caveat that can actually be quantified precisely: the earnings footnotes disclose that equity investment gains (including unrealized) totaled $36.9 billion in the quarter, contributing $28.7 billion to net income and $2.35 to EPS. Strip that out and core EPS comes to roughly $2.76 — against the $2.63 consensus, the actual core beat is about 5%, not the headline 94%. Operating income +29.7% and two points of margin expansion are still genuinely solid, but peeling out the investment gains before reading any earnings headline is just basic hygiene.

With that adjustment made, let's break down the $109.9 billion in revenue and see where it actually came from:

Table 1 · Alphabet Q1 2026 Revenue Breakdown
Segment Revenue YoY % of Total
Search & Other Advertising $60.4B +19% 55.0%
Google Cloud $20.0B +63% 18.2%
Subscriptions, Platforms & Devices $12.4B +19% 11.3%
YouTube Ads $9.9B +11% 9.0%
Network (AdSense / third-party) $7.0B -4% 6.4%
Other Bets (Waymo, etc.) $0.41B 0.4%
Total $109.9B +22% 100%
Google Services total $89.6B (+16%); excludes minor hedging gains/losses · Source: Alphabet Q1 2026 earnings report and earnings call

This table makes at least four things clear. First, Search is still the dominant contributor at 55% of total revenue — and it's accelerating. +19% growth is rare in recent history, and management's explanation directly rebuts the bears' main thesis from the past two years: AI hasn't killed Search; it has driven query volume to all-time highs. AI Overviews monetization is now approaching that of traditional Search, with retail and financial services as the primary drivers. The cash cow that had been sentenced to a slow death for two years just turned in an acceleration.

Second, Cloud is the growth engine — just not yet the revenue pillar. At 18.2% of revenue, it punches far above its weight in terms of the investment narrative: $20 billion in quarterly revenue (+63%), $6.6 billion in operating income, and a 32.9% operating margin. Cloud isn't just growing fast — it's already a high-margin business, which is what distinguishes it from the "buying share at any cost" story.

Third, subscriptions are becoming the third leg. Subscriptions, Platforms & Devices revenue reached $12.4 billion (+19%), with total paid subscribers across the company at 350 million, up 25 million in a single quarter — led by YouTube Premium and Google One bundled with Gemini Advanced. The trade-off: YouTube Ads at +11% came in slightly below expectations, as users converting to subscriptions cannibalize the ad line. Management has explicitly flagged that YouTube's ad and subscription revenue should be viewed together.

Fourth, the only decline is Network advertising (-4%) — the third-party ad distribution business continues to contract, though at 6.4% of revenue it's a rounding error in this table. Other Bets posted $410 million in revenue against a $2.1 billion operating loss; Waymo's 500,000 fully autonomous weekly rides are a headline-grabber, but financially immaterial for now.

Now for the AI-specific metrics. Gemini app users surpassed 750 million; API throughput hit 16 billion tokens per minute, up 60% quarter-over-quarter; Gemini Enterprise paid monthly actives grew 40% quarter-over-quarter. All of that demand flows into the Cloud segment: the quarter-end backlog nearly doubled sequentially to over $460 billion — contracted revenue not yet recognized, equivalent to locking in roughly 20+ quarters of current Cloud revenue. As a footnote, the company also raised its quarterly dividend 5% to $0.22 per share — a "we're not strapped for cash" signal.

KEY INSIGHT
A year ago, the market's discount on Alphabet reflected the fear that AI would eat search advertising. A year later, the market's premium reflects the realization that Alphabet is the one selling AI compute. Same company — moved from prey to predator in the AI narrative. That's the real engine behind the double.
03 The Price Tag: $190B in Capex and Free Cash Flow Cut Nearly in Half

The other side of the story is just as striking. To absorb that $460 billion backlog, Alphabet raised its full-year 2026 capex guidance to $180–190 billion (up from $175–185 billion), burning through $35.7 billion in Q1 alone — more than double year-over-year, with roughly 60% going to servers and 40% to data centers and networking.

To put $190 billion in context: it's roughly 40% of Alphabet's full-year revenue. The natural first question is whether earnings will get eaten alive. To answer that correctly, you need to read all three financial statements separately — three layers, three very different answers.

Layer one, the income statement: earnings haven't been eaten alive — they're expanding. Capex doesn't flow directly through the P&L; it's first capitalized and then depreciated over time. So Q1 operating income still grew 30% year-over-year to $39.7 billion, with margins expanding to 36.1%. But there's a deferred bill: management explicitly flagged on the earnings call that the step-up in infrastructure investment will continue flowing through the P&L in the form of higher depreciation and data center operating costs (energy, etc.). The pressure is coming — it's just on delay.

Layer two, the cash flow statement: this is where the damage is real. Q1 operating cash flow of $45.8 billion minus $35.7 billion in capex leaves just $10.1 billion in free cash flow — down roughly 47% year-over-year.

Chart 2 · Q1 2026 Cash Flow Waterfall ($B)
Operating Cash Flow (generated)
458
Capex (deployed)
357 (+107% YoY)
Free Cash Flow (remaining)
101
Source: Alphabet Q1 2026 earnings report

The full-year picture is even more revealing: Q1 operating cash flow annualizes to roughly $183 billion (the trailing twelve months came in at $174.4 billion), while full-year capex guidance is $180–190 billion — an almost exact 1:1 ratio. That means essentially every dollar of operating cash Alphabet generates in 2026 goes straight back into data centers. The cadence is also back-loaded: Q1 consumed only $35.7 billion, leaving more than $145 billion for the remaining three quarters — roughly $50 billion per quarter, making negative free cash flow in one or more quarters entirely plausible.

Chart 3 · Full-Year 2026: Cash Generated vs. Cash Deployed ($B)
Operating Cash Flow (Q1 annualized, approx.)
~1,830
Capex Guidance (upper end)
1,800–1,900
Operating cash flow and capex nearly 1:1 · 2027 capex guidance: "materially higher than 2026"

Layer three, the balance sheet: the company has far more than just its cash flow. Quarter-end cash and marketable securities stood at $126.8 billion, long-term debt at $77.5 billion, net cash roughly $49 billion — nowhere near "running low." But an easily overlooked detail: Alphabet issued $31.1 billion in senior unsecured notes during Q1. Raising the dividend and maintaining buybacks while simultaneously tapping debt markets signals that shareholder returns and capex can no longer both be funded from operating cash flow alone — the gap is being plugged with debt. This isn't inability to pay; it's a deliberate capital structure choice. But it marks a genuine turning point: the cash machine that once channeled a steady stream to shareholders is now directing all of its output toward its own next phase of growth.

CFO Anat Ashkenazi's explanation: "We are seeing unprecedented internal and external demand for AI compute." Translation: we're not spending for the sake of it — the orders are piling up at the door, and not expanding capacity means ceding share to Microsoft and Amazon.

So the precise answer to the opening question is: capex isn't eating into earnings — it's eating into free cash flow. The P&L is still expanding; it's the cash side that is fully committed, backed by $126.8 billion in reserves and open debt markets. The real debate is about return certainty: if the $460 billion backlog converts into high-margin revenue on schedule, today's capex is the cheapest entry ticket in company history. If AI demand growth decelerates or backlog conversion stretches out, then nearly $190 billion this year — plus the "materially higher" 2027 guidance — becomes a depreciation overhang that weighs on the P&L for years. The bulls and bears are looking at exactly the same numbers.

04 Valuation: An Alphabet Problem — or a Whole-Market Problem?

Any discussion of "can I still buy after the double" has to address valuation. But let's widen the lens first: the more unsettling question may not be Alphabet's valuation specifically, but the valuation of the entire market it trades in.

According to The Motley Fool, the S&P 500's Shiller CAPE ratio — which smooths cyclical swings using ten years of inflation-adjusted earnings — stood at 41.72 as of end-June, roughly 140% above its 155-year historical average of ~17.4, and just 3.5% below the all-time peak set during the dot-com bubble in 2000.

Chart 4 · S&P 500 Shiller CAPE: How Close Are We to 2000?
155-Year Historical Average
~17.4
Current (end-June 2026)
41.72
Dot-Com Bubble Peak (all-time high)
~43.2
Current level is just 3.5% below the all-time peak · Source: The Motley Fool

An even more extreme signal comes from the Buffett Indicator (total U.S. equity market cap / GDP). Buffett himself has called it "probably the best single measure of where valuations stand at any given moment" and has warned that when it approaches 200%, investors are "playing with fire." It currently sits above 233%, an all-time high. In a CNBC interview at this year's Berkshire annual meeting, Buffett said: "We've never seen people more enthused about gambling than they are right now."

Curiously, market sentiment itself is far from euphoric. The June 2026 AAII survey showed roughly 45% of individual investors bullish over the next six months and 36% bearish — a clear split. And CNN's Fear & Greed Index spent most of June pinned in "Fear" territory. Valuations in the stratosphere, sentiment on the ground — this rare combination implies the market's rally is being driven not by retail exuberance but by fundamentals themselves, particularly the genuine earnings power of companies like Alphabet propping up elevated multiples. That's both the good news (this isn't a pure sentiment bubble) and the bad news (if earnings disappoint, there's no sentiment cushion to absorb the hit).

05 Conclusion: Buying After the Double Means Running Two Separate Sets of Books

Back to the title question: is it too late to buy? The answer depends on which set of books you're running — and they must be kept separate.

The first set of books is the business itself, over a multi-year horizon. On this dimension, the quality is unambiguous: full-stack AI capability (proprietary TPUs + Gemini models + cloud distribution), Cloud growing at 63%, $460 billion in backlog visibility, 36.1% operating margins, and now a Dow-certified "cornerstone of the economy" designation. As a long-duration holding, it ranks among the highest-conviction names in the AI infrastructure wave. On this dimension, a constructively bullish stance is the more defensible position.

The second set of books is today's price: $359.91. On this dimension, clarity is essential: a meaningful portion of the past year's 100% gain was a one-time re-rating from the re-categorization trade — and that alpha has already been captured by whoever held it. Buyers today can only earn Act Two — the execution premium on backlog converting to revenue and $190 billion in capex converting to returns. And Act Two plays out against a CAPE of 41.72 and a Buffett Indicator at 233%. Any execution miss will be punished severely. The risk/reward for chasing here is materially worse than it was a year ago.

The honest framing, then: bullish on the business, respectful of the price. For existing holders, this is not an exit. For new buyers, going all-in at current levels offers poor risk/reward; scaling in gradually and waiting for a market-level pullback to provide a better entry is the more rational path.

Finally, three falsification tests — conditions that would require revisiting the above conclusions. First, if Google Cloud growth decelerates materially over the next two quarters and backlog conversion disappoints, the Act Two earnings narrative gets directly impaired. Second, if free cash flow keeps deteriorating while capex guidance continues to ratchet higher, "investing for growth" slides toward "investing for overcapacity." Third, if the broader market's CAPE compresses sharply from its historic highs, even Alphabet's best-in-class fundamentals won't hold up against a wholesale downward shift in the valuation anchor. Watching these three indicators is more useful than watching the daily price chart.

This is fundamentally not a question about whether Google can keep going up. It's a question about how much you're willing to pay for execution once the re-rating is over. The double belonged to whoever was willing to go against consensus a year ago. The next leg of returns belongs only to those who have run both sets of books.

Data note: Share price as of the July 2, 2026 close (no live trading on July 4 Independence Day holiday or the weekend). Financial and cash flow data sourced from Alphabet's Q1 2026 earnings report, earnings call, and public reporting by 24/7 Wall St. and The Motley Fool; verify against the latest market data before publication.

This article is for informational purposes only and does not constitute investment advice, trading recommendations, or any guarantee of returns. Investing involves risk.

This content is for informational purposes only and does not constitute investment advice, trading advice, or any guarantee of returns.

Keep Reading

One Month After SpaceX: Tesla Holds Steady, but at the Cost of a 371x P/E

One Month After SpaceX: Tesla Holds Steady, but at the Cost of a 371x P/E
OURALPHA · 个股深度

After SpaceX IPO
Tesla's 371x Bet

Tesla (TSLA) · A Month of Reversal from 'Drained' to 'Merger Fantasy'

Wall Street once feared that SpaceX's largest-ever IPO would drain Tesla of capital and attention.

One month later, SpaceX's stock has held steady around $150, while Tesla has stabilized on Q2 delivery recovery and merger narrative.

But at roughly 371x trailing P/E, everything hinges on the July 22 earnings report and the pace of autonomous driving delivery.

TSLA · Key Data

$406.55

Current Price (Jul

Read full story →

Stay ahead of the market — never miss a deep dive

Follow OurAlpha for AI-driven US equity research and market insight, every day.